Understand the Asset Key Performance Indicators
The Key Performance Indicators (KPIs) gives you a quick, at-a-glance, view of how a particular Asset is doing.
Watch the Video
Audio: Sound Video Length: 1:31 minutes
Learn more
- Navigate to Assets.
- Click the Show KPI
 icon.
icon.
Going across the top of the screen the following dynamic tools are:
- Asset Failures - This shows the count of assets with open work orders that have a work type that uses a Failure Code.
- Asset Category - This graph is a break-down of open work orders across asset categories.
- Assets Not Utilized - This shows assets with meters or logs that have a primary meter or log. If these have not been updated within the time, then it is considered not utilized.
This is determined by the time listed in the Data Confidence setting (found under Settings > Module Settings > Work Order Settings > General).
- Average Age - This is based on the asset's manufacture date, and is the average of all assets age.
- Cost Compare - This shows if you are up or down in costs from last month and are you up or down in costs compared to last year?
- Click on any of the KPI tiles (excluding Cost Compare), it will display the relevant assets in the list.
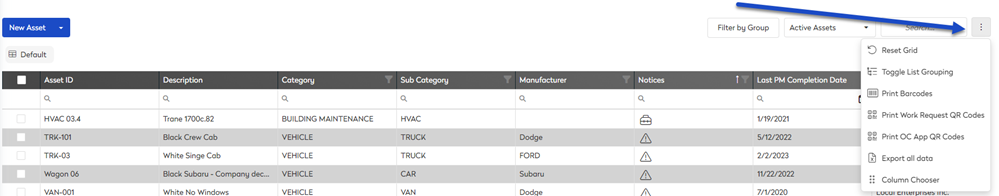
You can reset the view, click the More Actions  icon, and then Reset Grid.