COVID-19: Employee Locations (USA) and COVID-19 Case Statistics Dashboard
Purpose
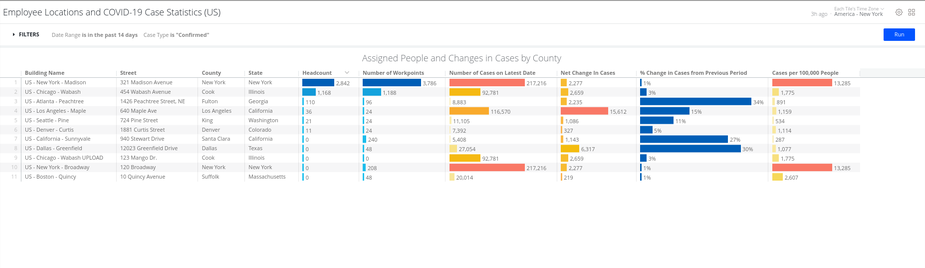
Use this dashboard, as a stand-alone or in-conjunction within the COVID-19 Portfolio Overview - United States Dashboard, as this provides deeper level of detail on the relative effect and trend of the pandemic to your organization’s people and locations within the United States. The table lists buildings together with case statistics specific to the county in which each building is located.
Special Data Elements
-
COVID-19 case data comes from https://starschema.com/covid-19-data-set where it is updated daily from multiple sources.
Special Filters
-
Date Range filter - This determines the start date for calculations behind the “Net Change in Cases” and “% Change in Cases from Previous Period” columns.
- As this table displays detailed statistics only for the United States counties the filters are permanently set to filter information for buildings located in the United States. For all other locations, see the global COVID-19: Employee Locations (USA) and COVID-19 Case Statistics Dashboard.
Limitations
-
Insights looks up each building's county based on the building’s city and state values using reference data that we do not guarantee or actively maintain.