Using Floorplans in Visualizations
You will notice that some of the Explores contain the Floorplan view and this will let you add a floorplan visualization.
Let's have a look at this simple example using the Location Explore.
From the Floor view, add the Floor Name with Building If Multiple as a filter as you want to filter on a particular field.
The Floorplan Viewer can only display 1 floorplan at a time if you try and visualize it with multiple floors in the output this would cause an error. Therefore, when there are multiple floorplans to output, you can include the Floorplan Viewer filter set to Yes to stop the multiple floorplans from loading.

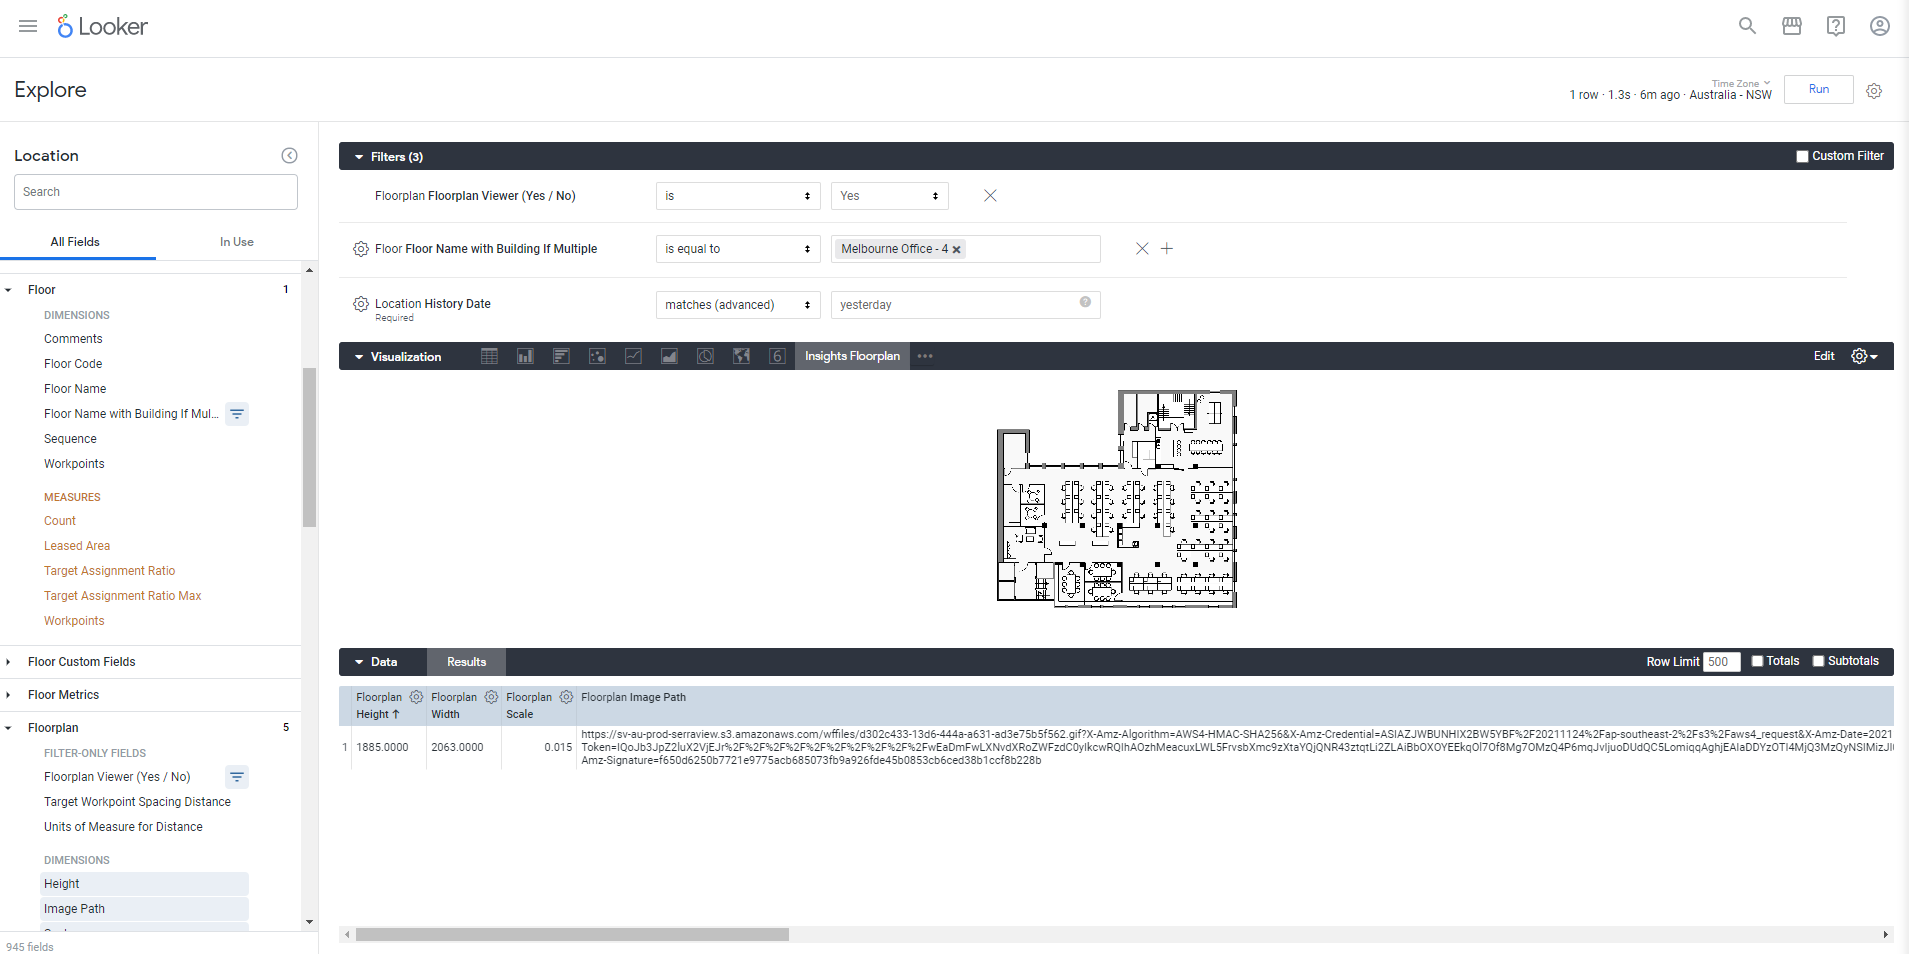
Next, from the Floorplan view, add the Floorplan Viewer (Yes / No) as a filter, leave the default selection set to Yes as you only want one floorplan to display. Then from the Floorplan view, add the following:
- Height
- Width
- Scale
- Floorplan Image Path - The image path is needed for the floorplan visualization component to know where to get to the floorplan image.
Click the Run button to run the query.
To see the Visualization, click the More Action ![]() icon and then select Insights Floorplan.
icon and then select Insights Floorplan.
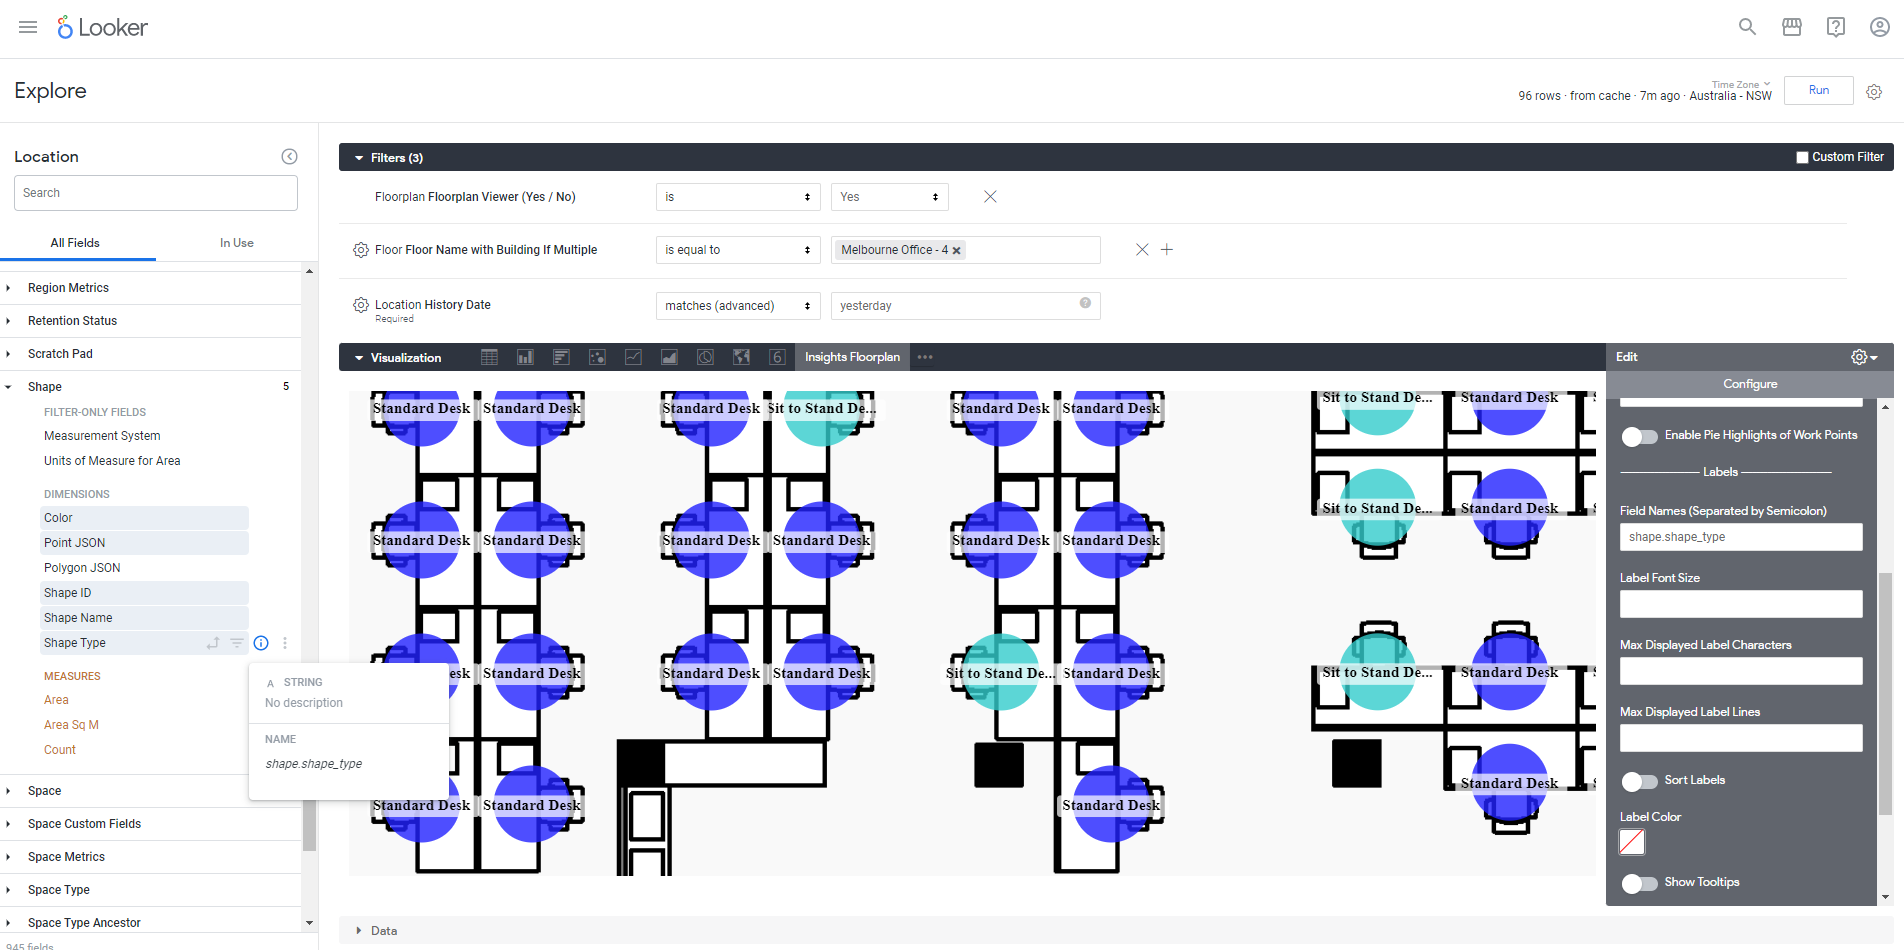
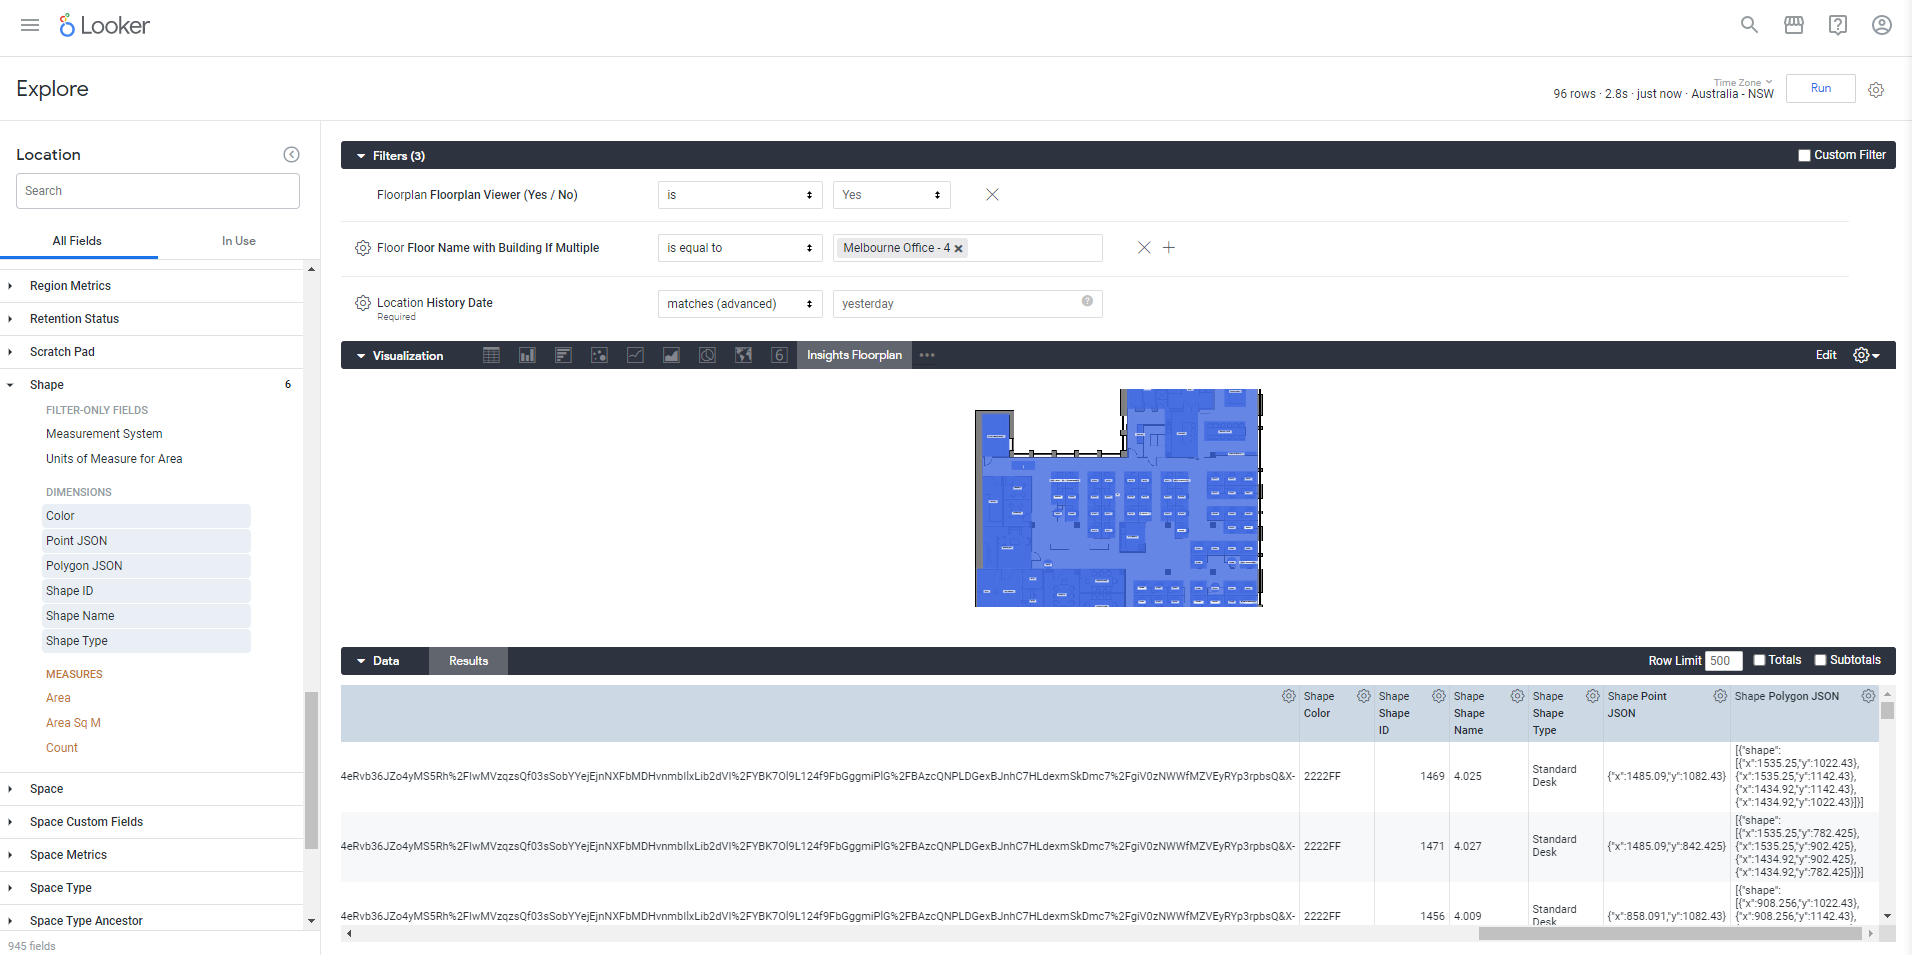
Next, you will want to bring in the shapes from the Shapes view. You can add the following:
- Shape ID
- Shape Name (optional)
- Shape Type (optional)
- Color (optional - if a color has been assigned to a shape)
- Point JSON (optional - these give you workpoints)
- Polygon JSON (optional - these give you the polygon of the shape)
Click the Run button to run the query.
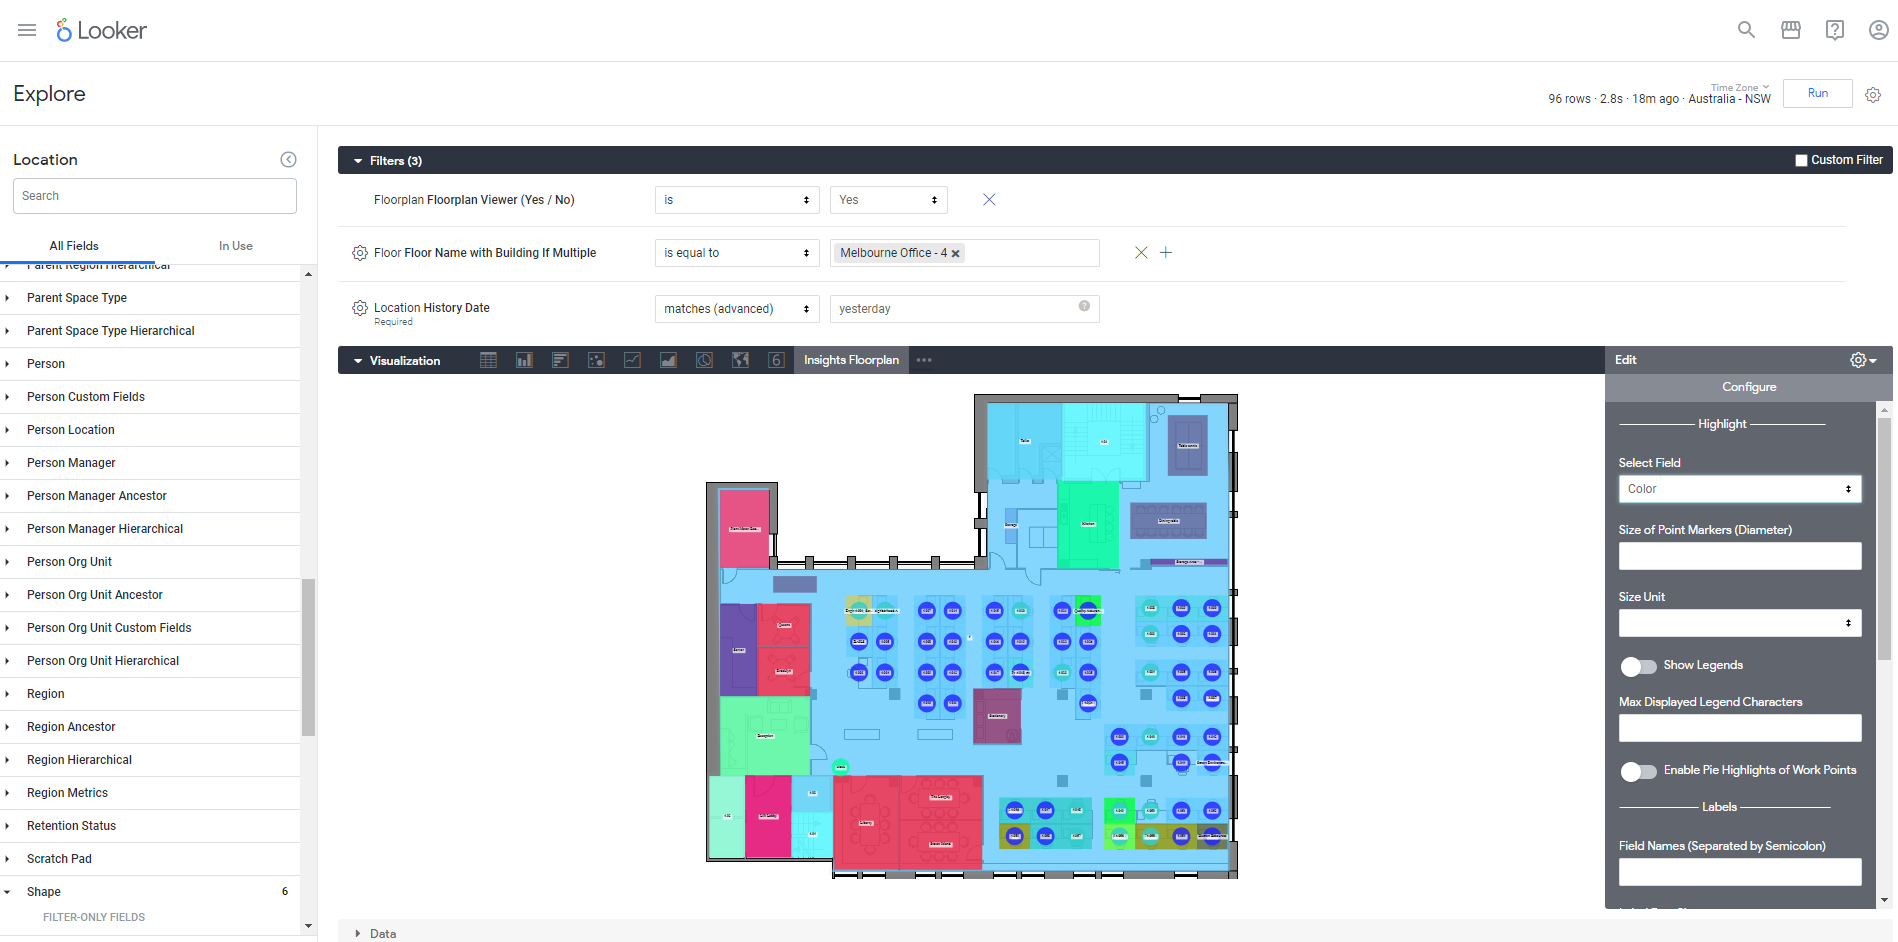
Additionally, there are settings on the visualization that can be used. From the Visualization area, click the Edit to display the settings.
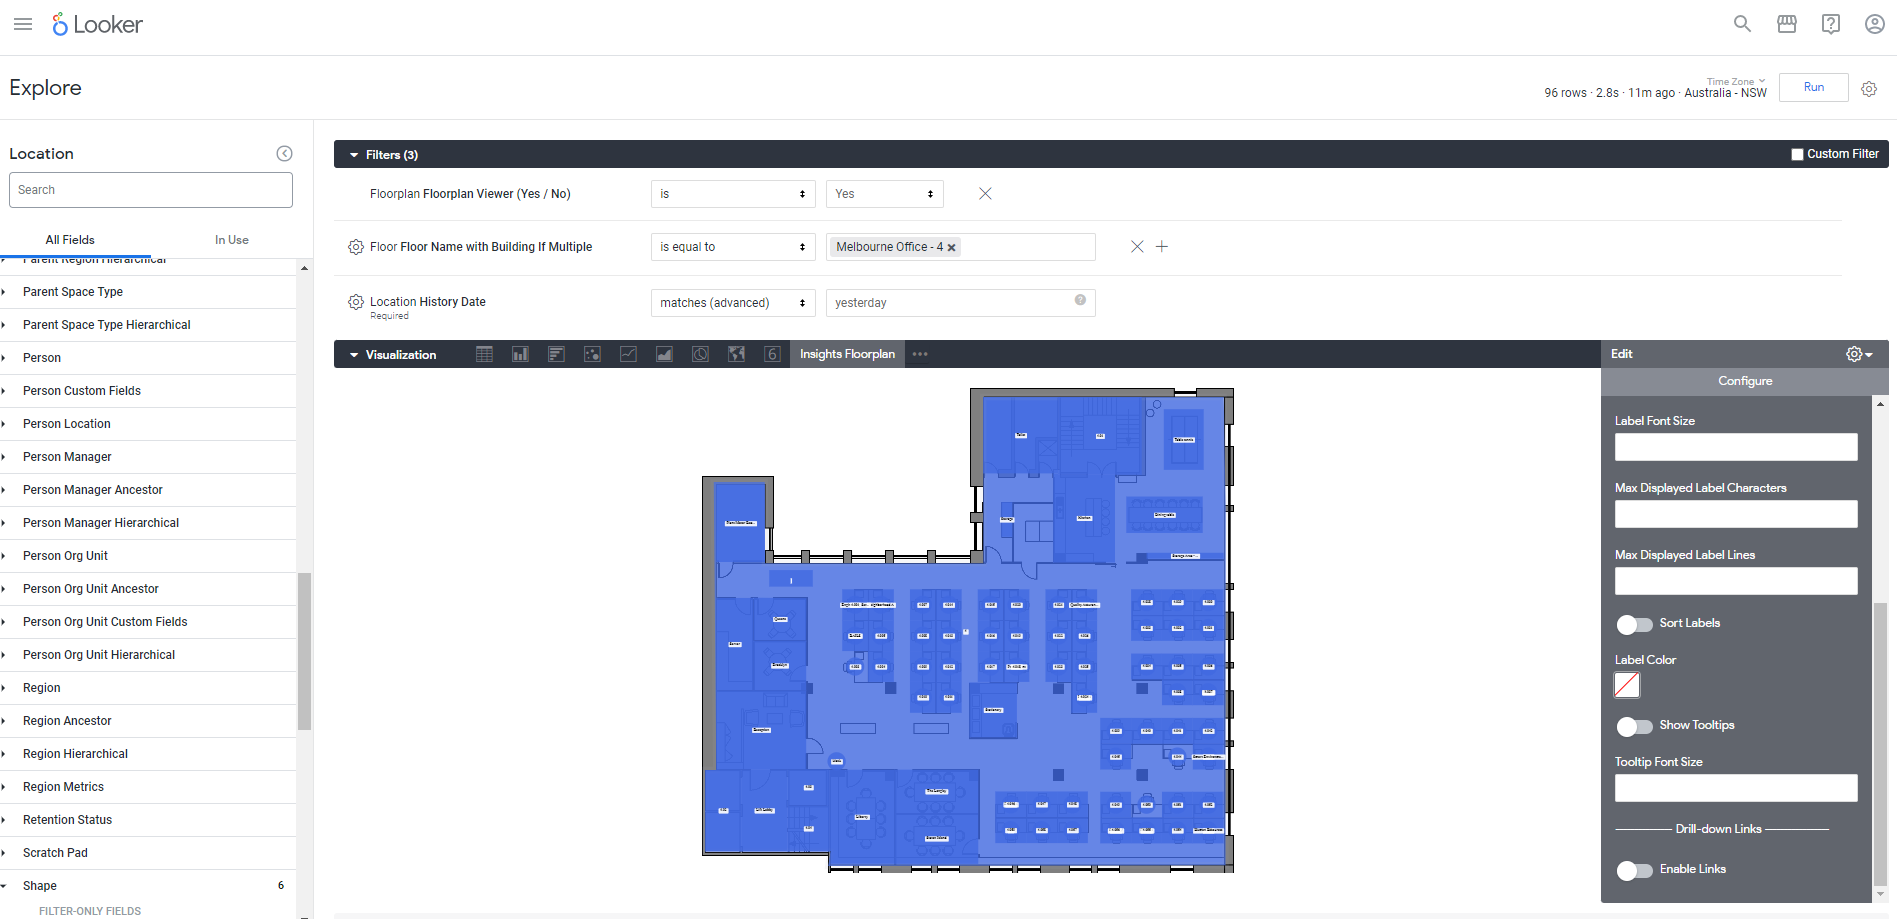
Below are a few examples of what you can do.
Color
As you brought in Color then from the Select Field drop-down you can select Color.
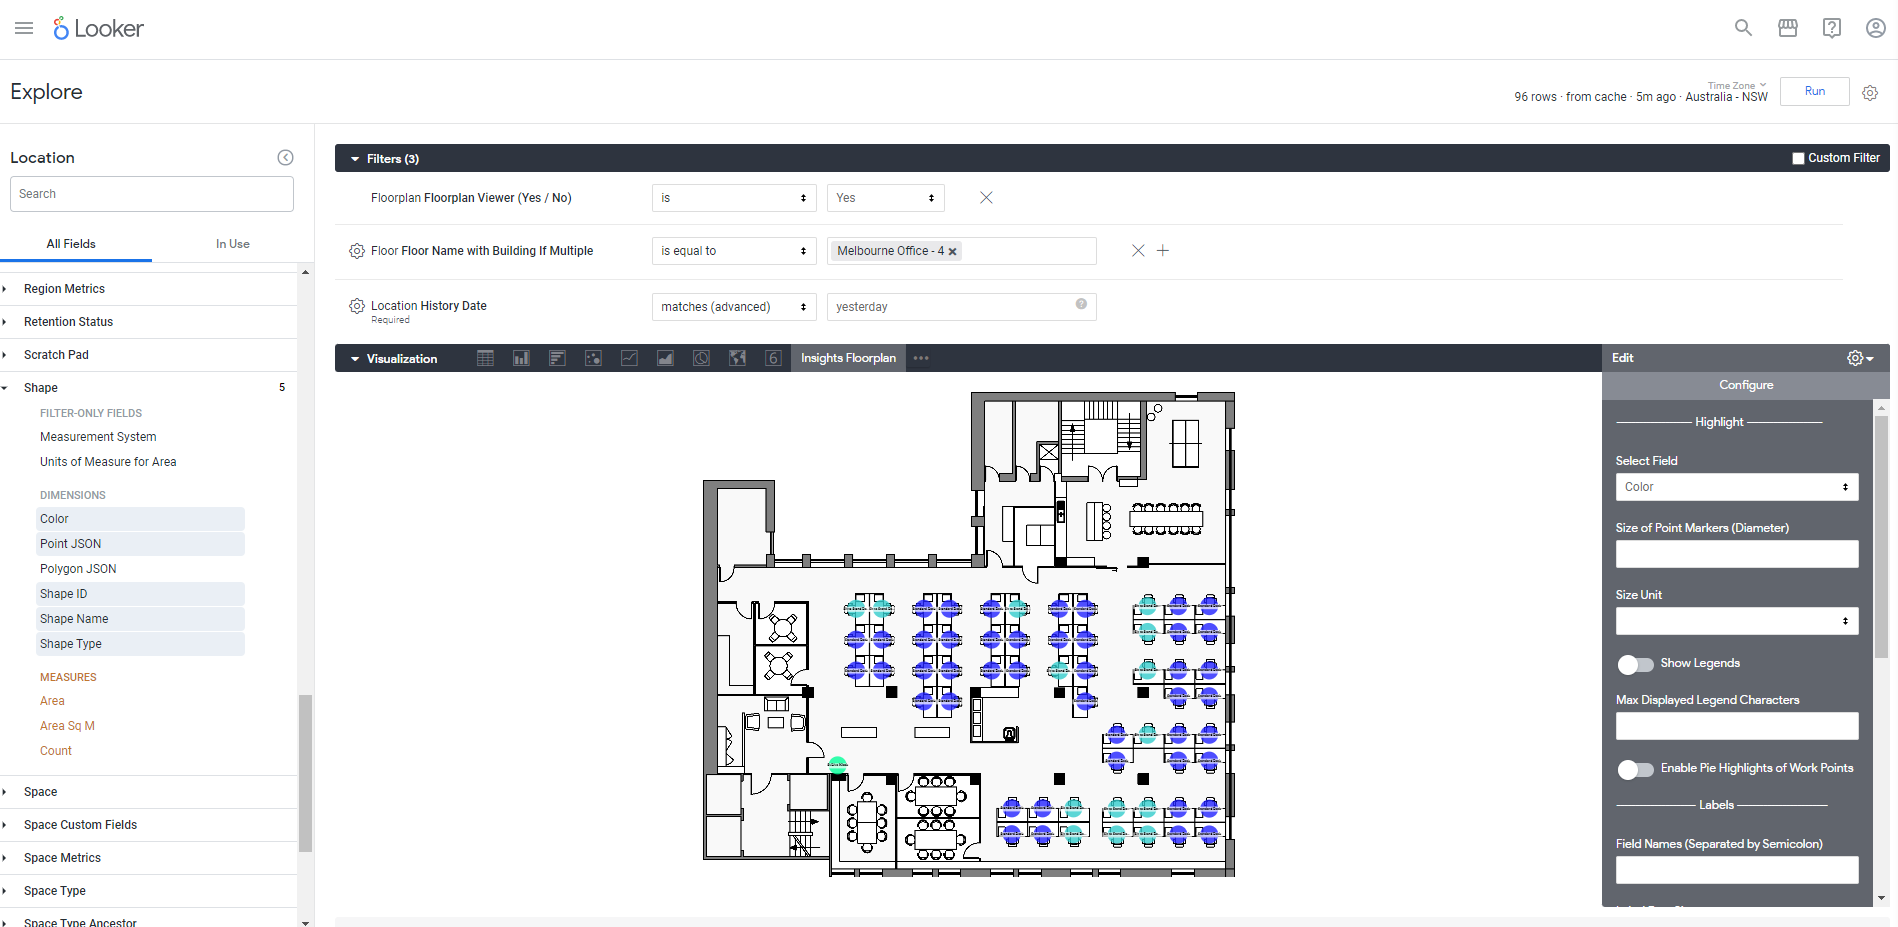
Points
If you want to only display the workpoints then only bring in Points JSON (do not include Polygon JSON) and then from the Select Field drop-down you can select Color.
Field Names
If you want to change the field names, then for the dimension click the Info icon and copy the Name for example shape.shape_type and then enter it in the Field Names field,