Using Org Unit Levels in Visualizations
Your Org Unit data is joined on the Locations as well as the Person. It is important to know that a person’s org unit may not be the same as their location’s org unit.
Let's have a look at this simple example.
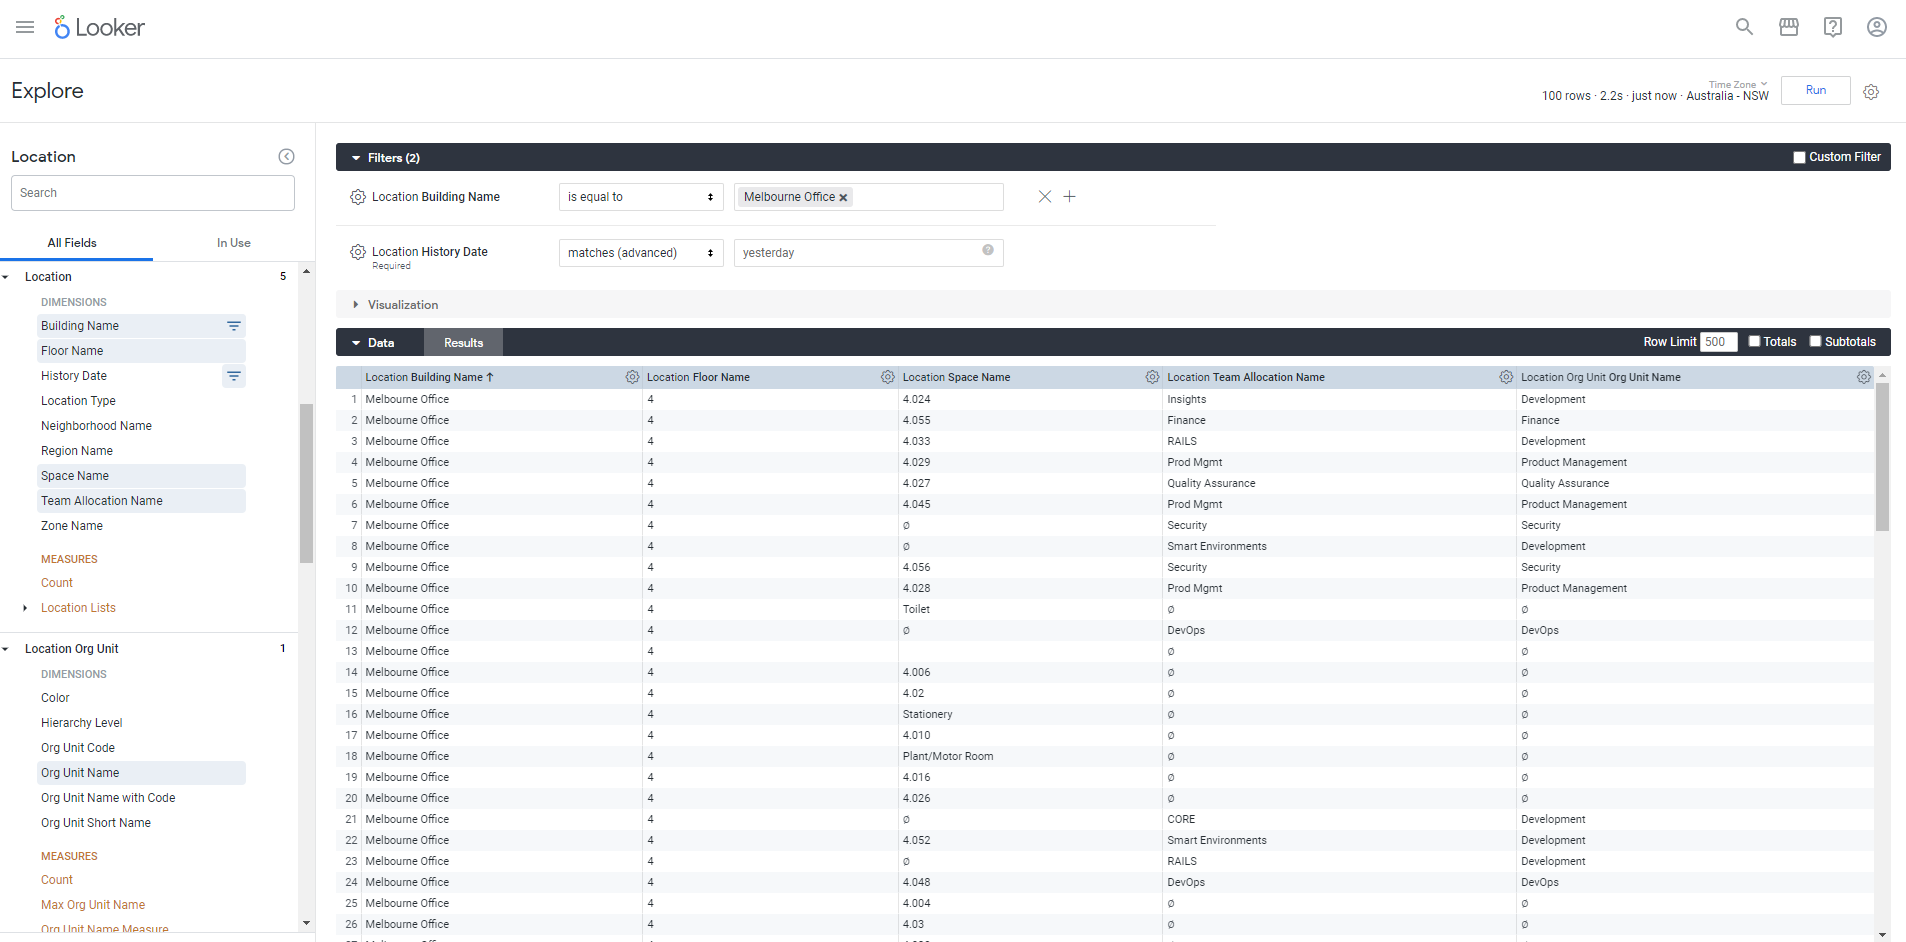
Add the Location's building name as a filter as you will want to filter to a particular building.
Then in the Data Results add the Location's building name, floor name, space name, and team allocation. Then from the Location Org Unit view add the Org Unit Name as this is what you want to use in the visualization to show the location's org unit.
When you are ready, click the Run button.
This shows you which space belongs to the teams and the team's org unit determines the org unit of the space.
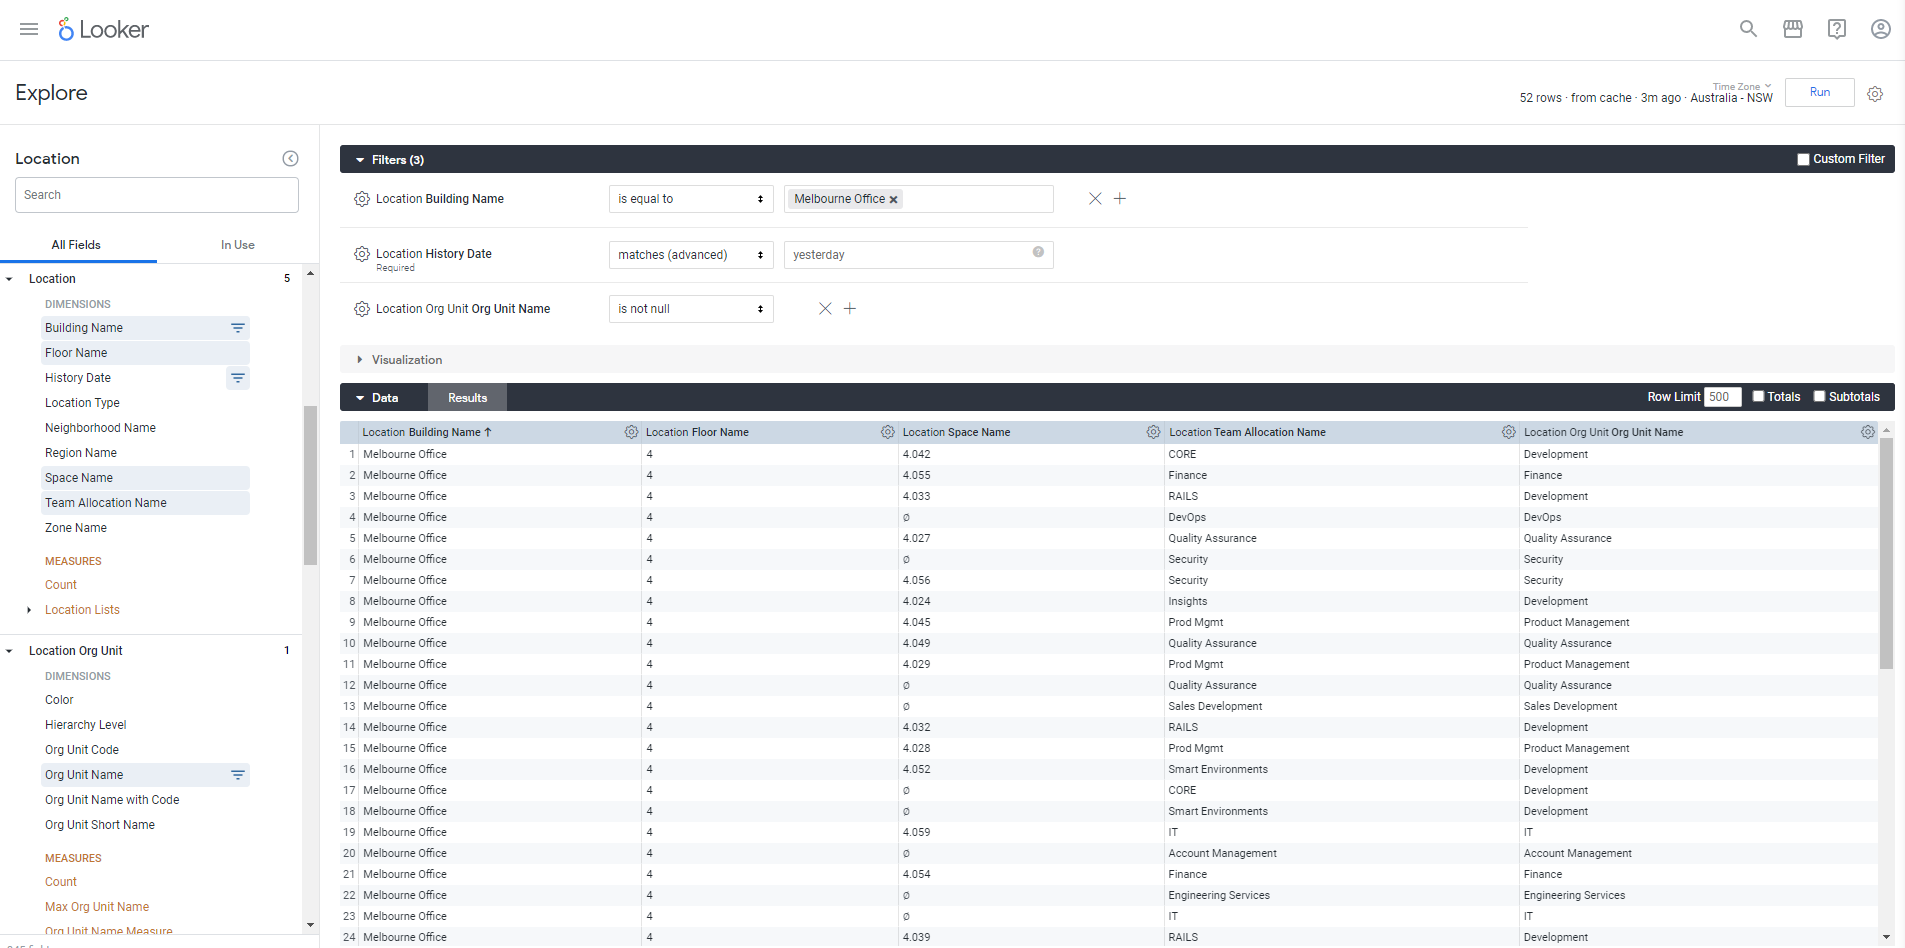
If you want to clean up the Data Results then add the Location Org Unit's Org Unit Name as a filter and apply is not null and then Run the results. This will only display spaces that have an Org Unit Name assigned to it.
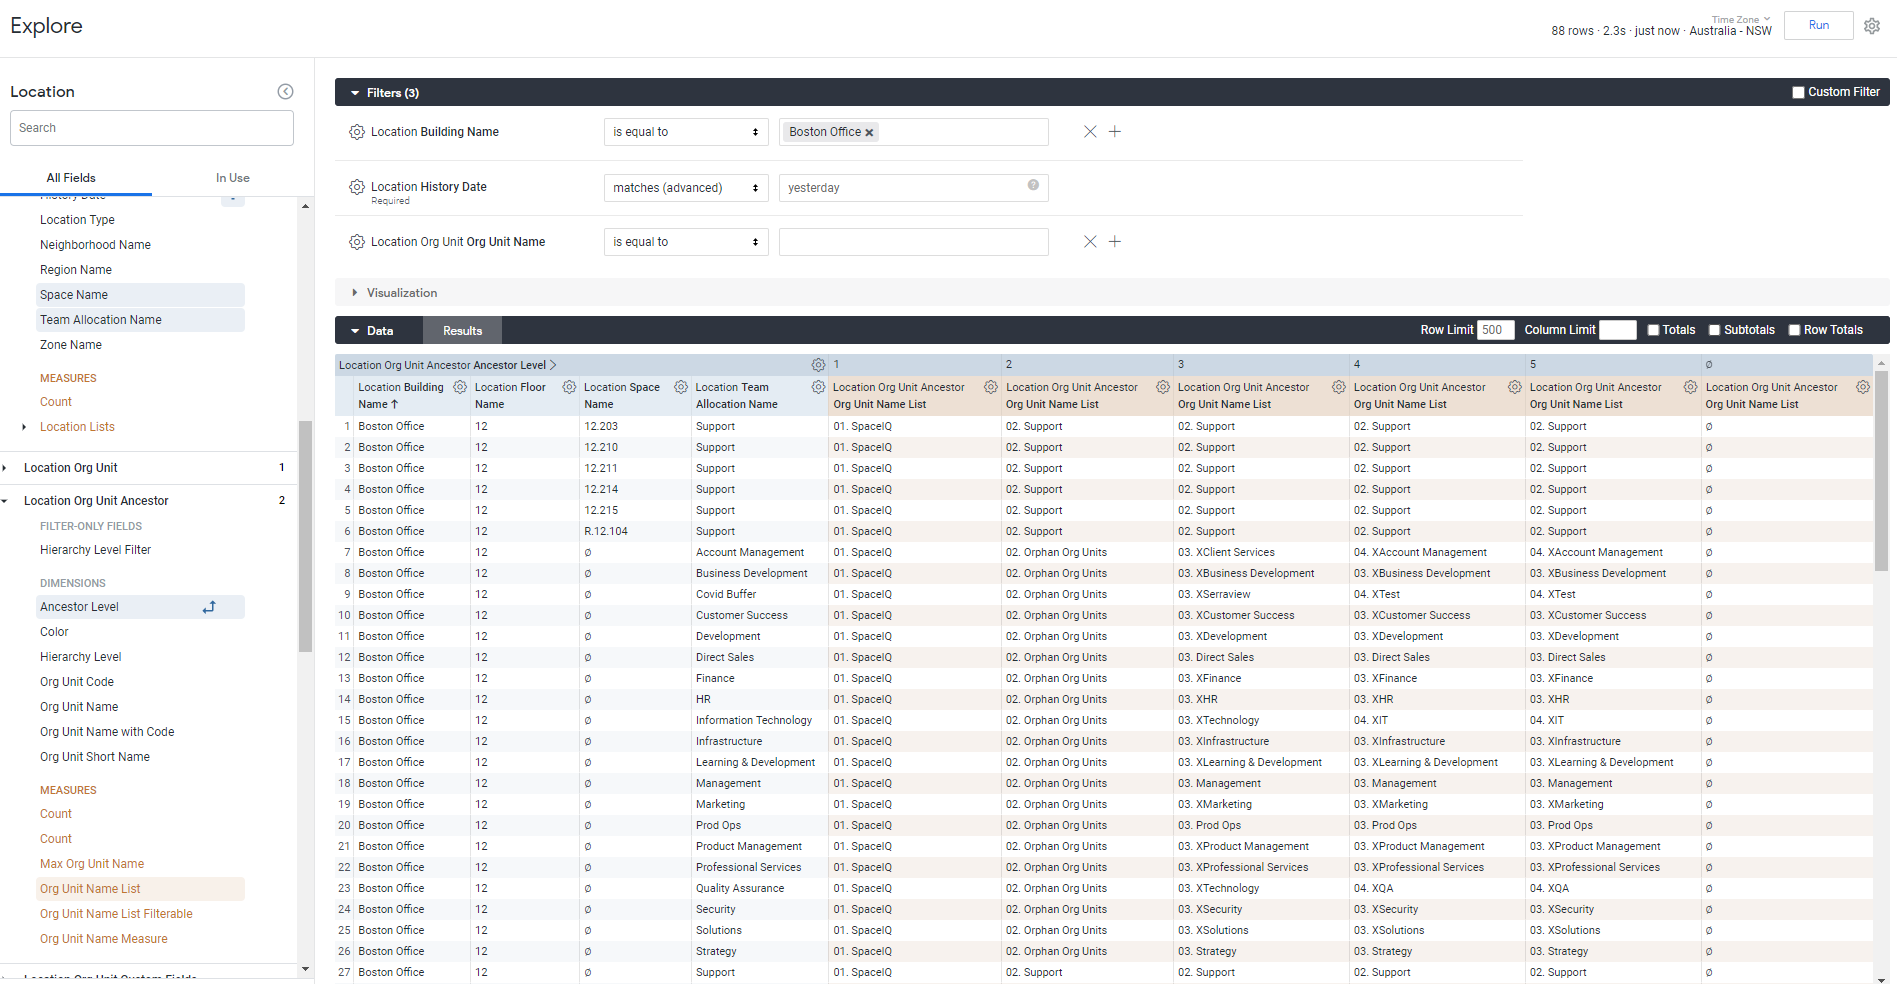
Using the Location Org Unit Ancestor View
When you want to filter on an ancestor org unit at a certain and above. For example, the Small Business Org Unit is at Level 3 so when you run the query for this it will bring in the org unit at Level 3 and the ones above which are the ancestors.
- Level 1 – State-wide Business
- Level 2 – Regional Business
- Level 3 – Small Business
- Level 4 – Retail Business
Show the Org Units in Horizontal Columns
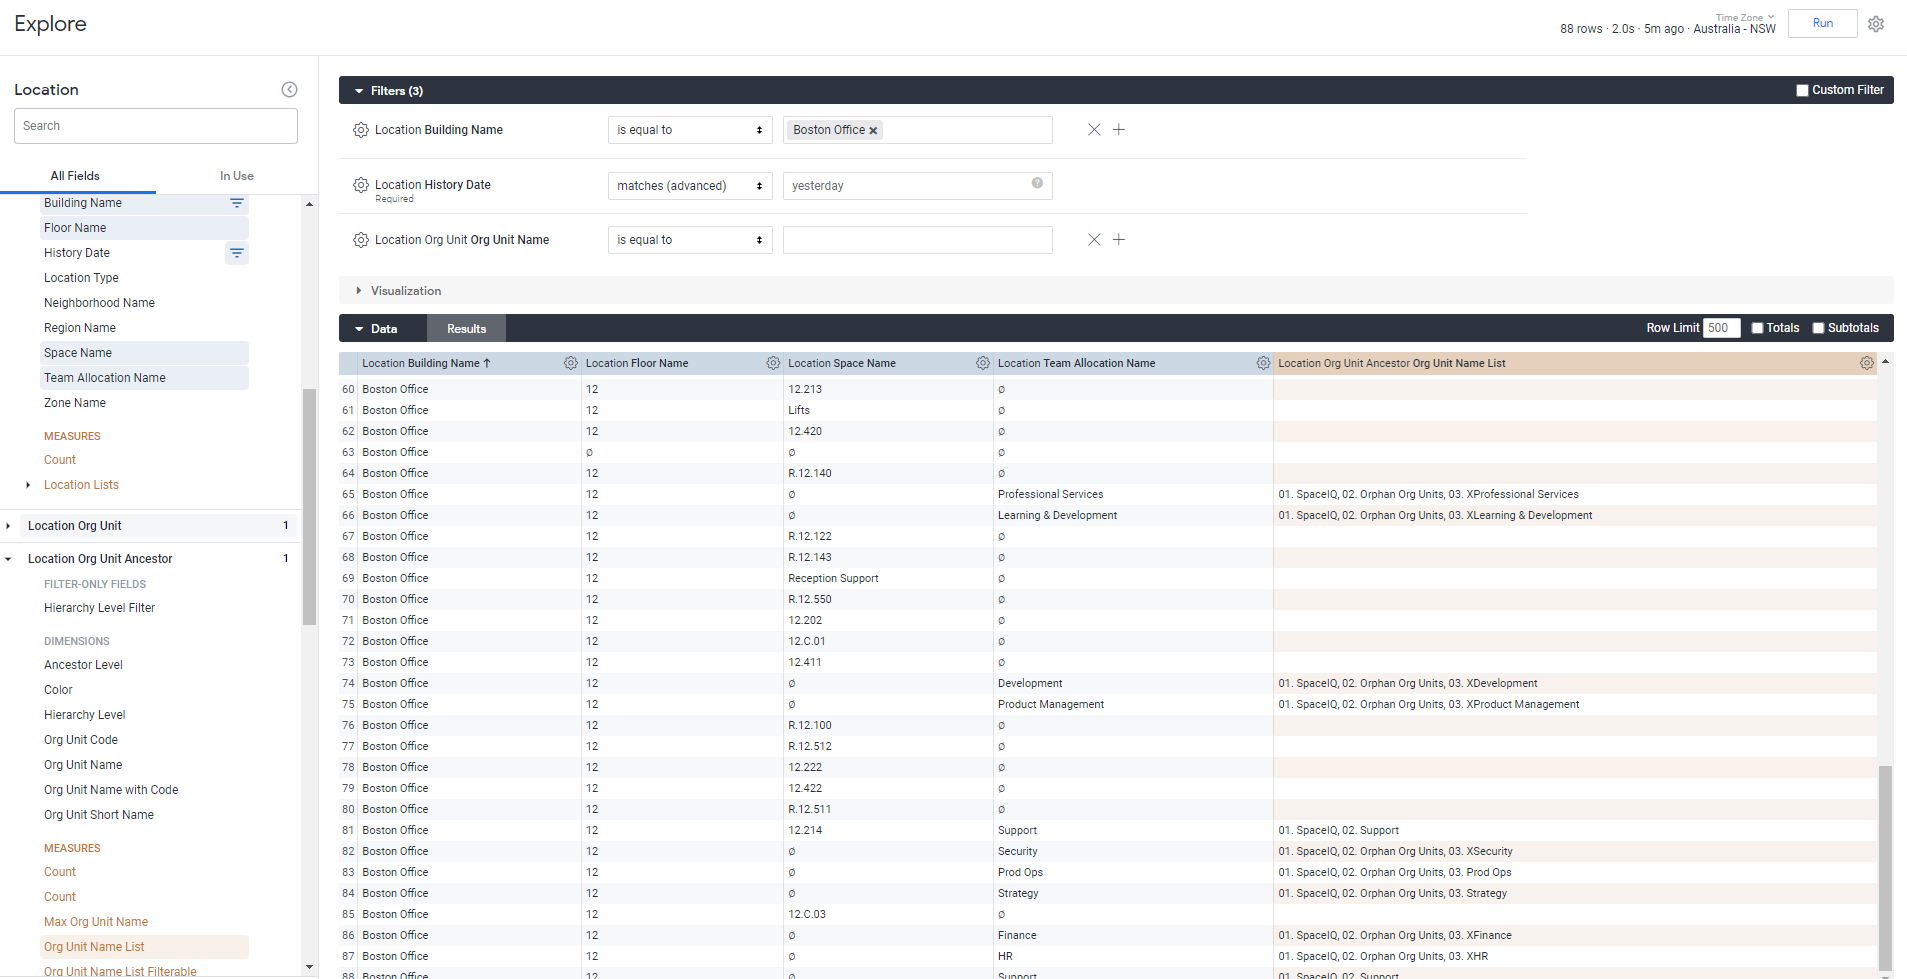
When you want to show the org units in horizontal columns then add the Location Org Unit Ancestor’s Org Unit Name List as a column.
Method 1 - Use Table Calculations
In this method, you need to add horizontal columns for each org unit using a table calculation. However, you have the flexibility to add which columns you require.
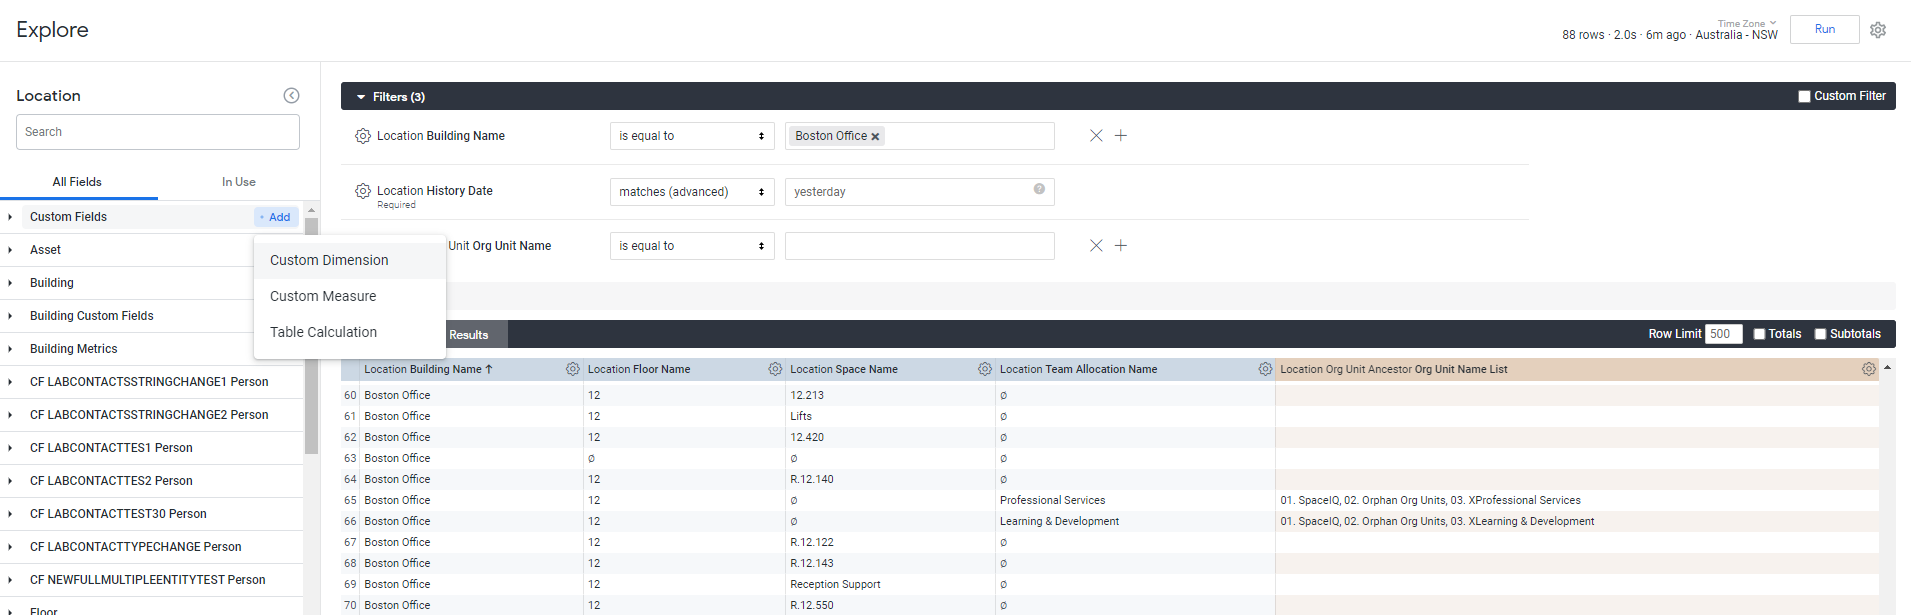
From the Customer Fields area click the + Add button and select Table Calculations.
Then enter in the expression to index the list to reference the element. In this example, you reference the third element and then call it Level 3.
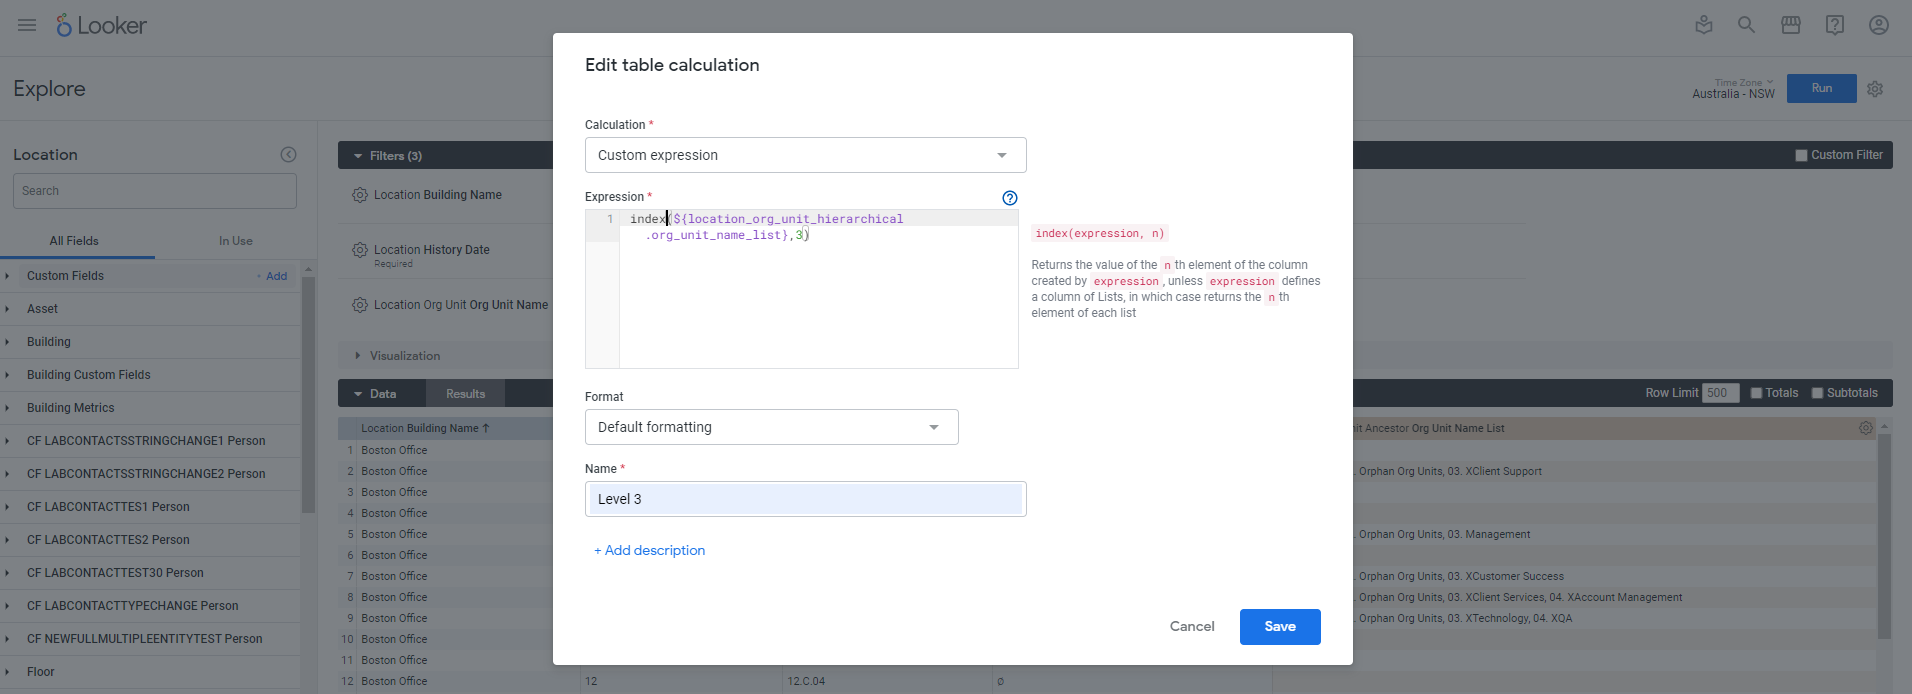
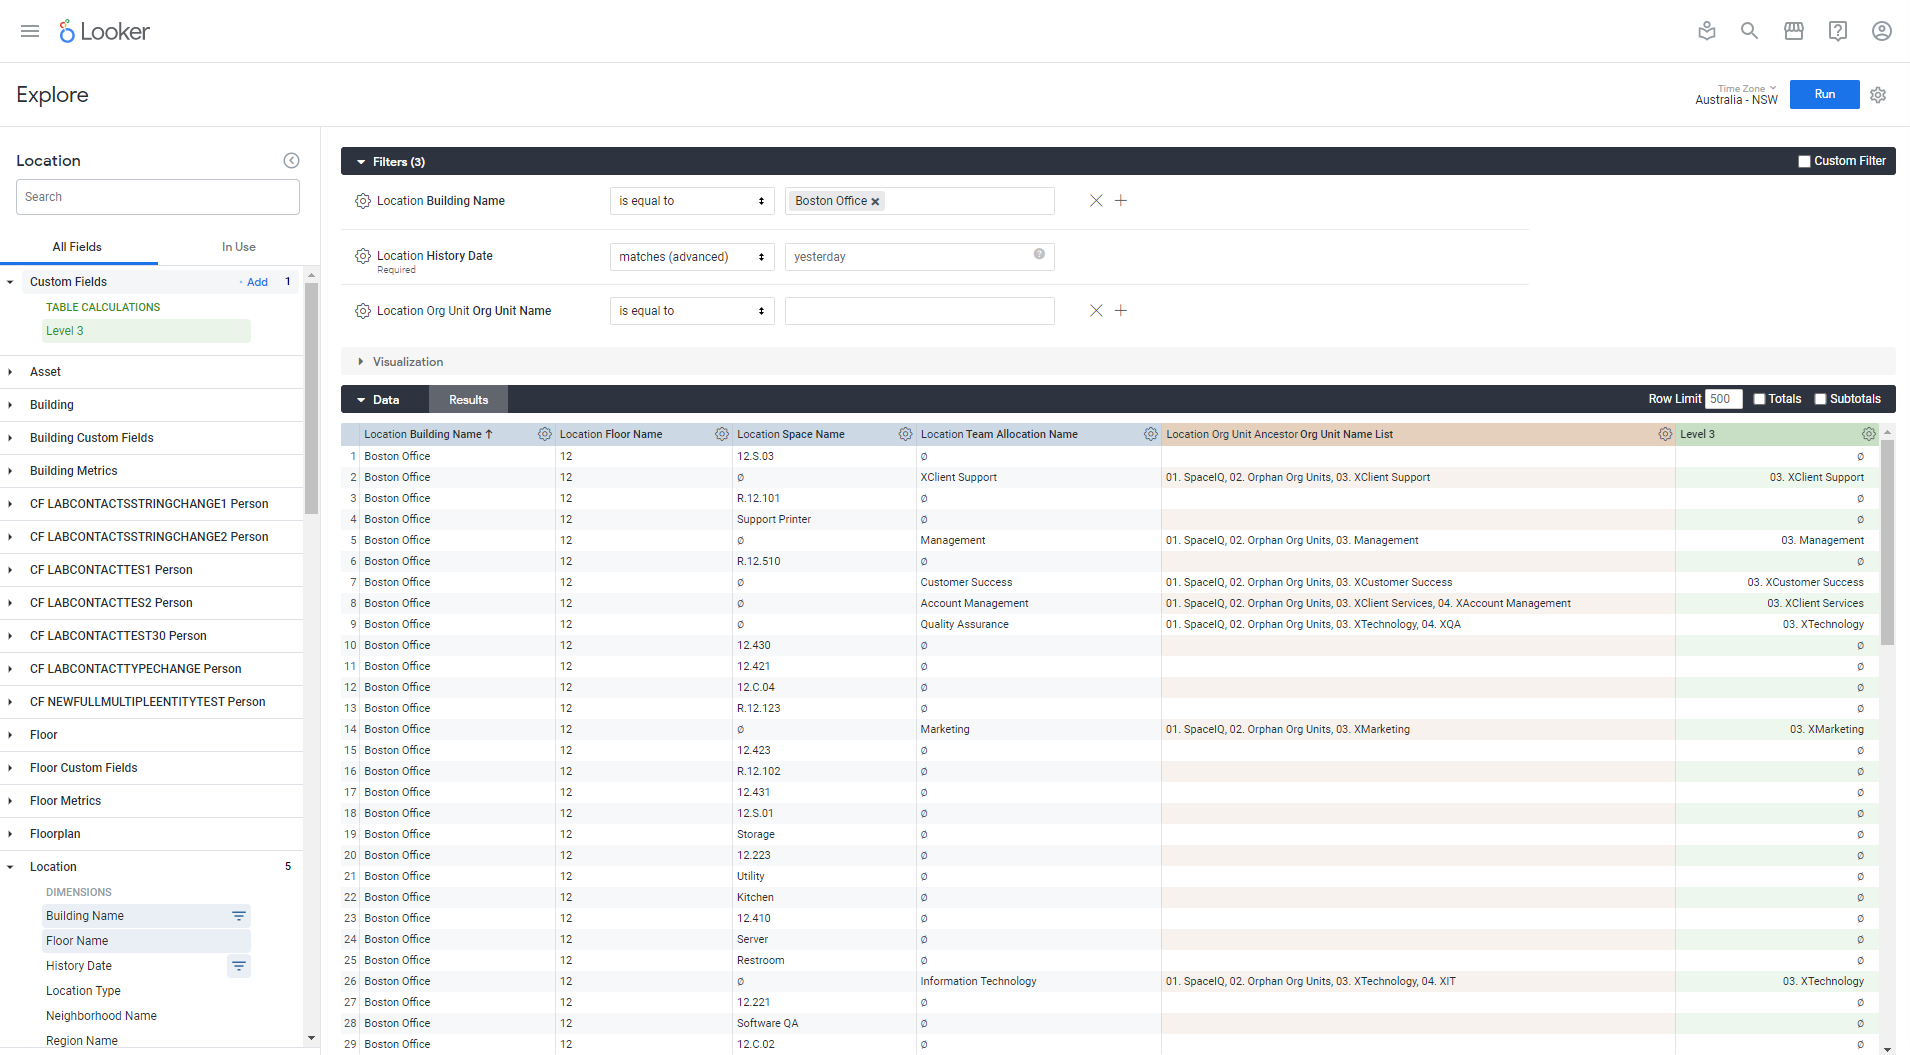
Save the expression and then it displays as a column. Keep adding table calculations for the org unit levels you want to show.
Method 2 – Use a Pivot Table
This method is quicker, but it is less flexible as it will display all the columns as you would expect in a pivot table.
First, let’s add a measure called Org Unit Name List from the Location Org Unit Ancestor view.
Pivot on the Ancestor Level and then click the Run button to run the query.