327 Utilization - Building and Floor Details
Overview
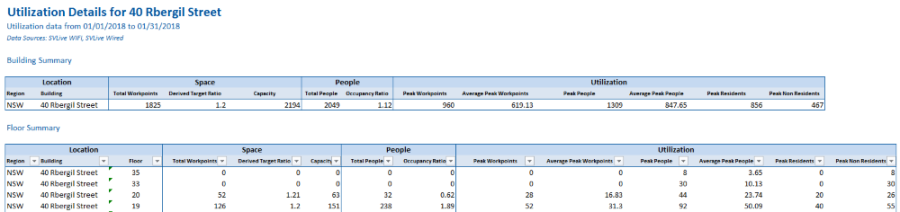
This report details utilization for all buildings and floors within the chosen location (you can choose a floor, building, or region, or leave the filter blank to choose the entire portfolio).
Key Data
- Building and Floor Summary tab - Displays utilization statistics for the whole date range for each building and floor selected. The figures shown include Peak Workpoints, Average Peak Workpoints, Peak People, Average Peak People, Peak Residents, and Peak Non-Residents.
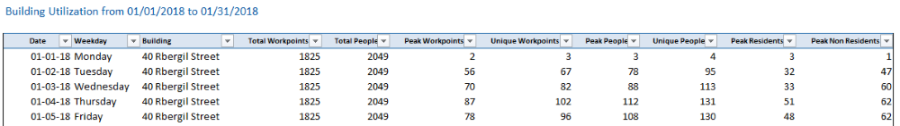
- Building Daily Breakdown tab - Displays the utilization for each building for each day of the date range.
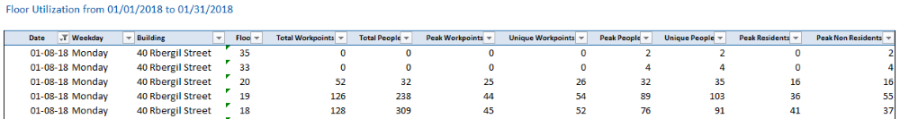
- Floor Daily Breakdown tab - Displays the utilization for each floor for each day of the date range.
- There is a label that tells you which data sources are contributing to the utilization stats e.g. SVLive Wi-Fi, SVLive Wired, Sensors. Depending on your setup, this can change based on which region, building, or floor you have selected.
- Some of the statistics shown may not be relevant for you; for instance, if your portfolio uses primarily Wi-Fi, then the Peak Workpoint figures may not be helpful. You can contact the Serraview Support team to remove these from your report.