Portfolio View
Your Portfolio View contains a collection of every Building and its Floors within your real estate portfolio and it provides statistics about the employees, density, and seat usage.
Contents
Navigate to the Portfolio View
Navigate to Portfolio ![]() and the sub menu Portfolio View
and the sub menu Portfolio View ![]() . This displays the buildings and floors in your portfolio.
. This displays the buildings and floors in your portfolio.
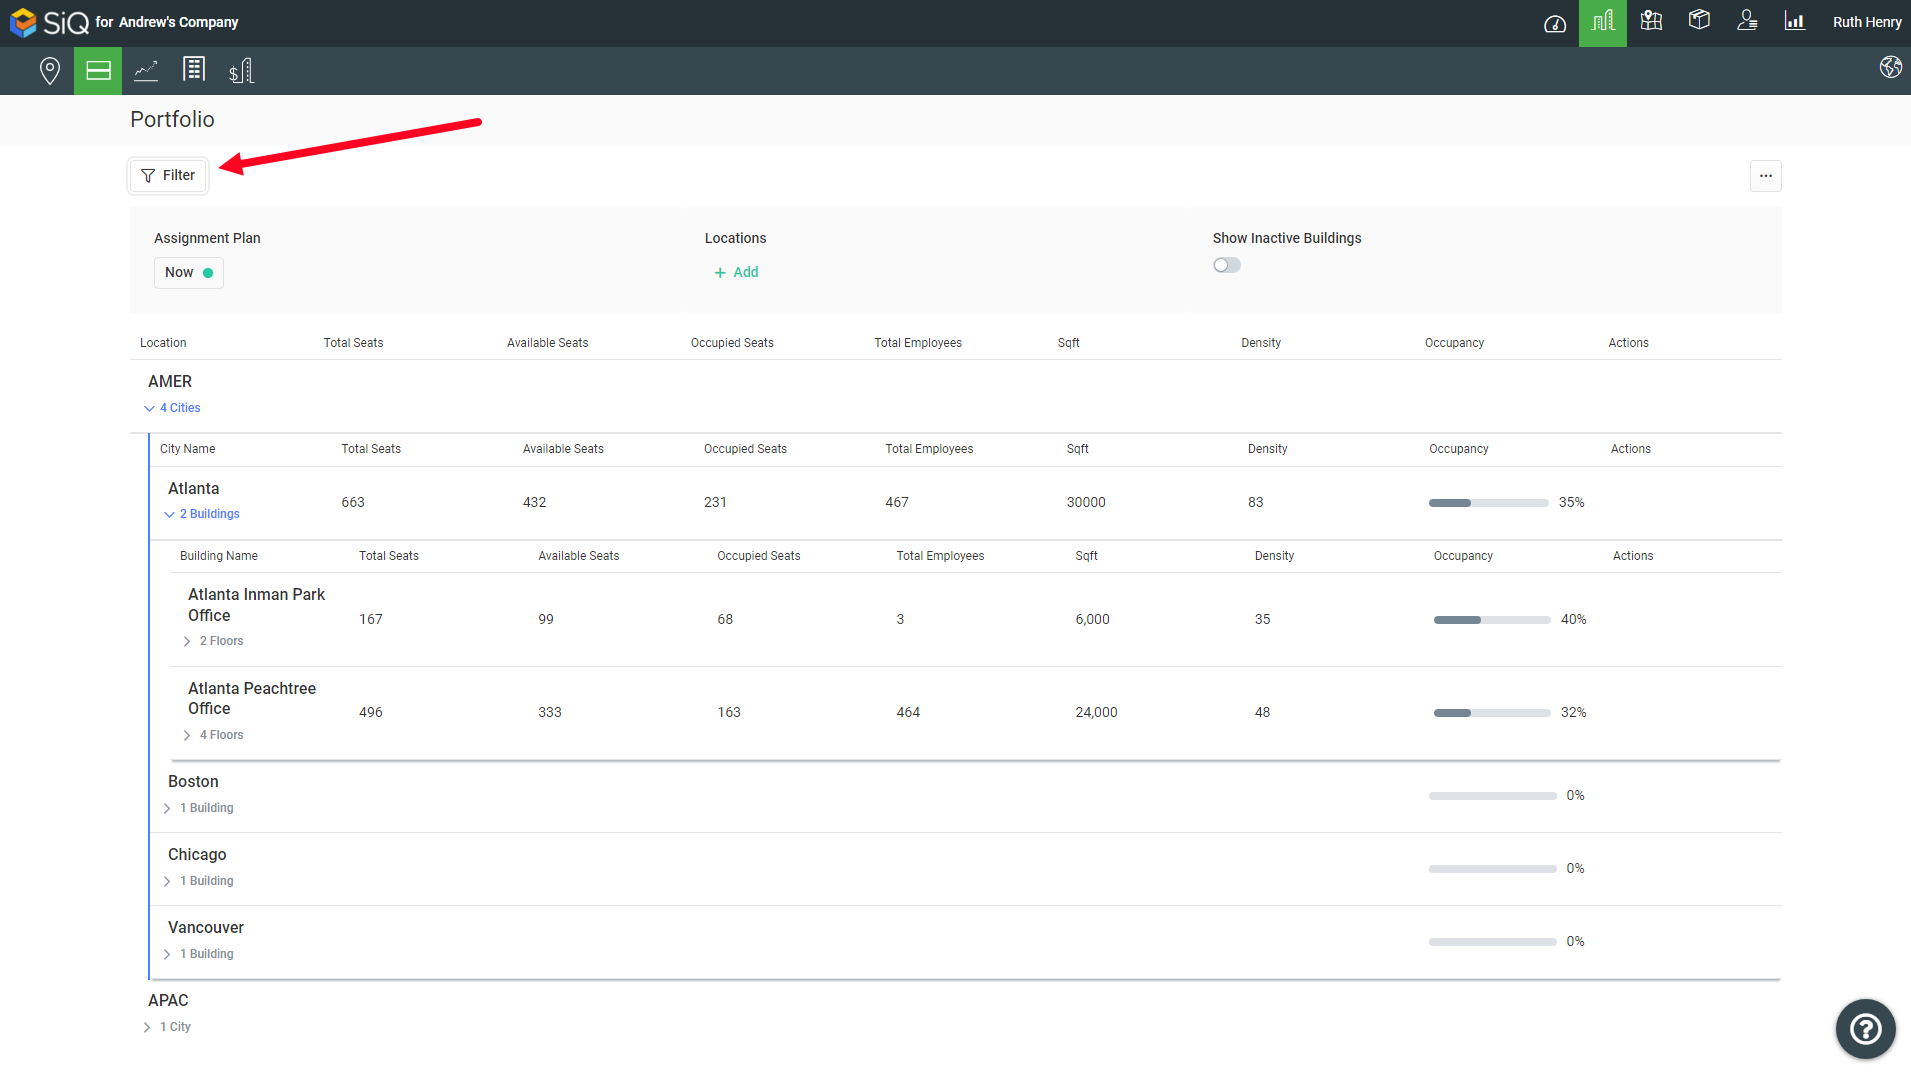
Portfolios are organized into four tiers: Regions, Cities, Buildings, and Floors. You can either browse your buildings or apply a filter to quickly find the building.
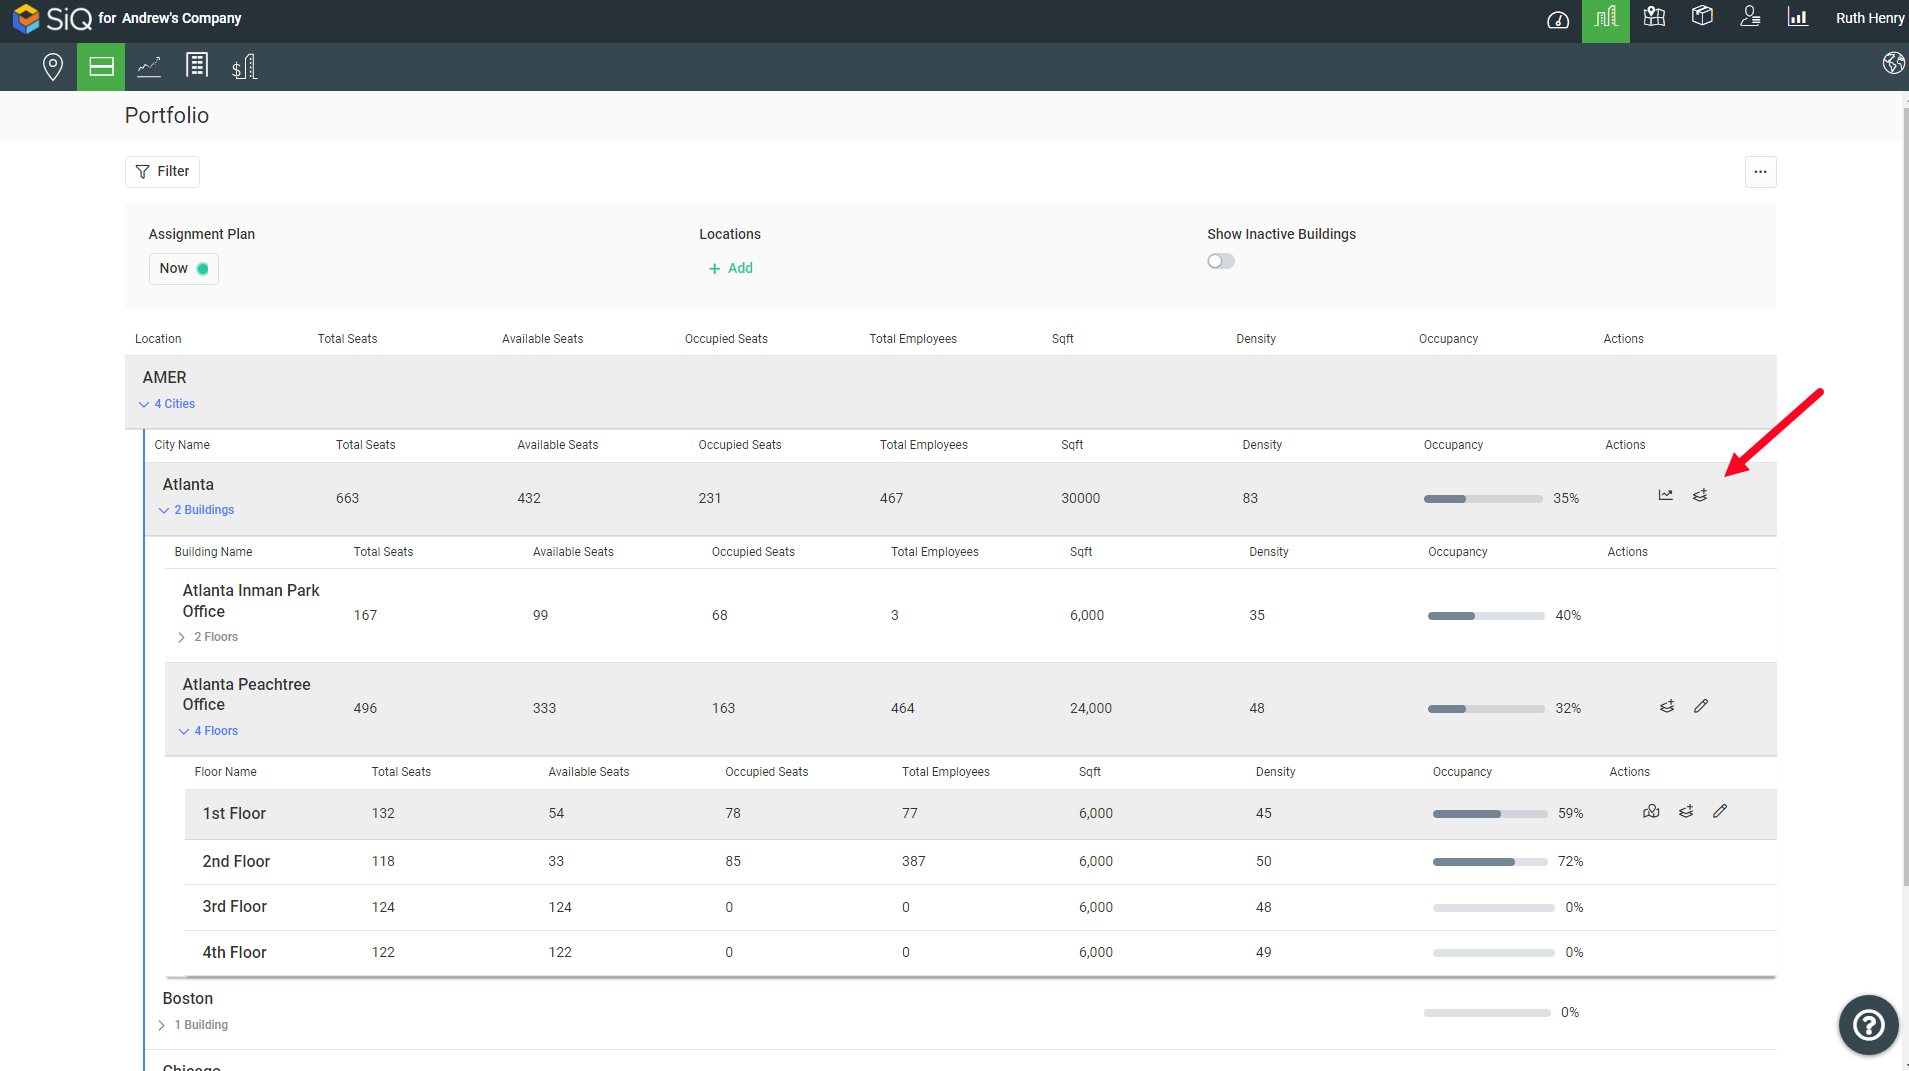
You will notice as you expand your buildings and floors, the Actions column will display icons when you hover over a row. These icons are quick shortcuts to either:
- Projections
- Stack
- Floor plan
- Manage Floor
Portfolio View Statistics
Remember when you click on a Building Name or Floor Name this will display the seat usages, see View a Building and Floor's Seat Usage.
The building and floors' statistics displayed are:
- Total Seats - displays the total seats for the building or floor. Hover on the number to display more details and if you click the show details this will take you to the details screen.
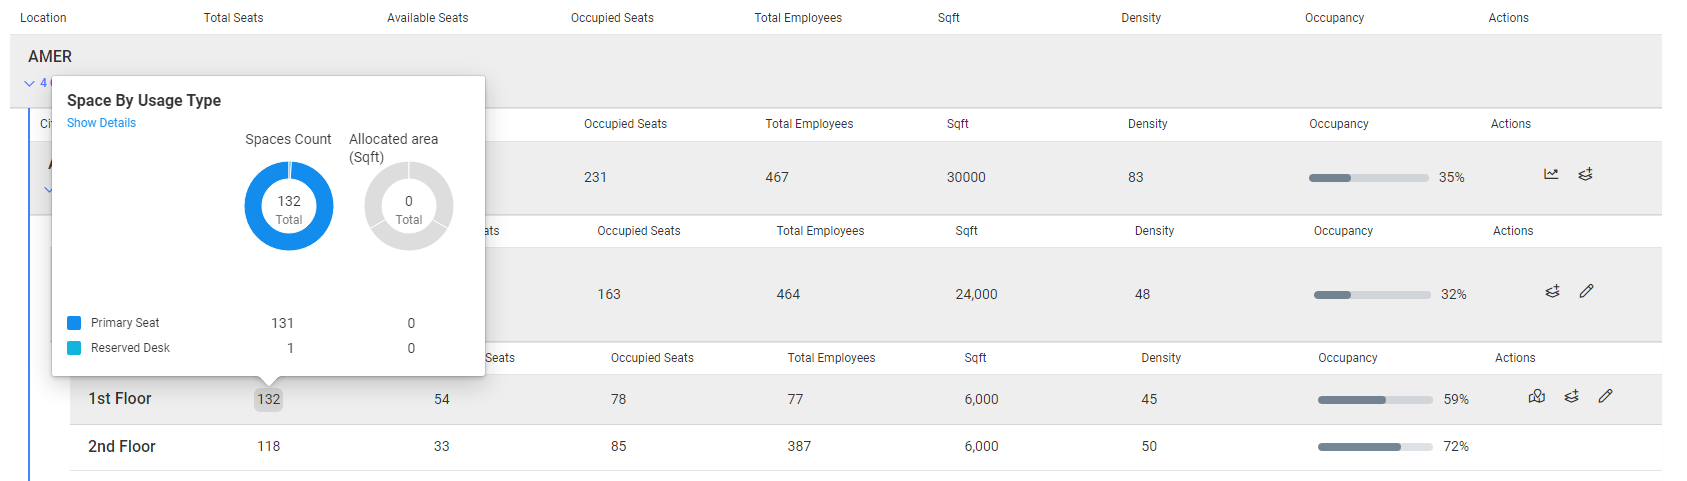
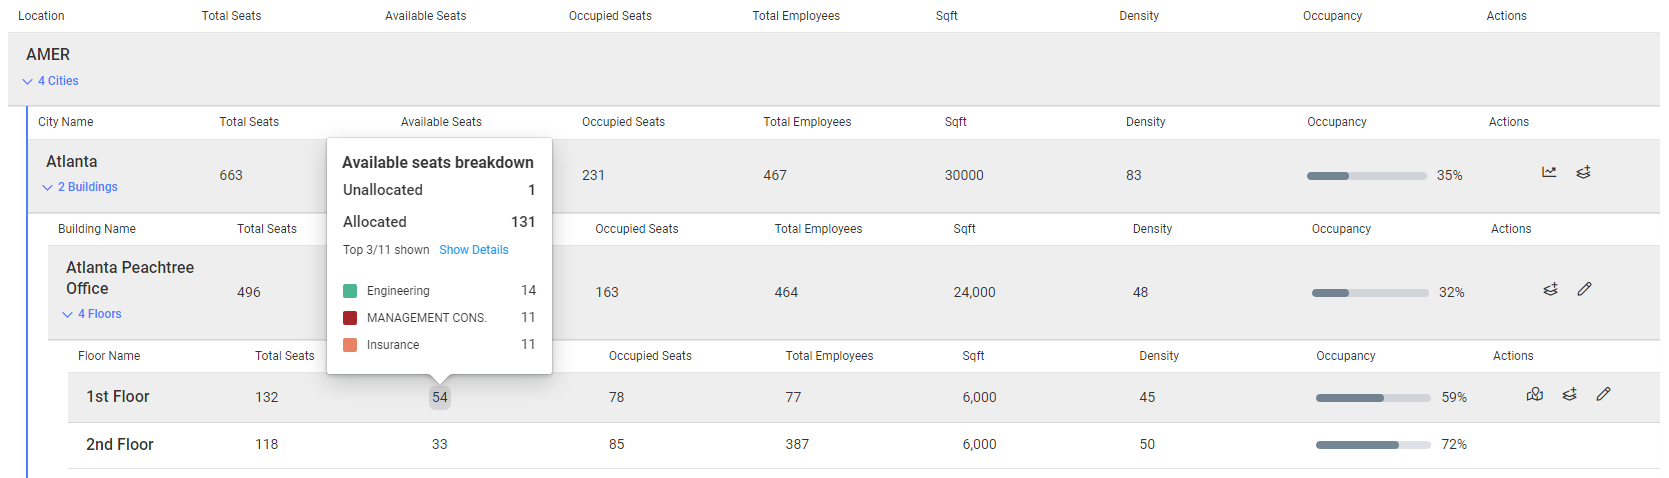
- Available Seats - displays the available seats for the building or floor. Hover on the number to display more details and if you click the show details this will take you to the details screen.
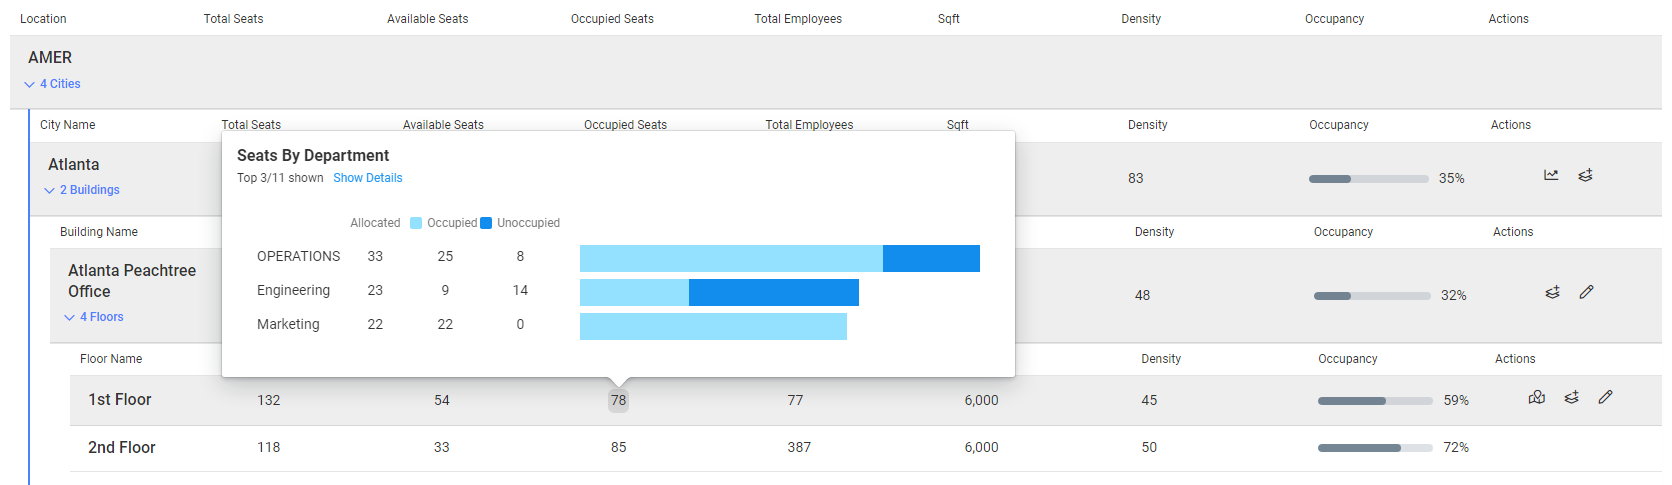
- Occupied Seats - number of occupied seats for the building or floor. Hover on the number to display more details and if you click the show details this will take you to the details screen.
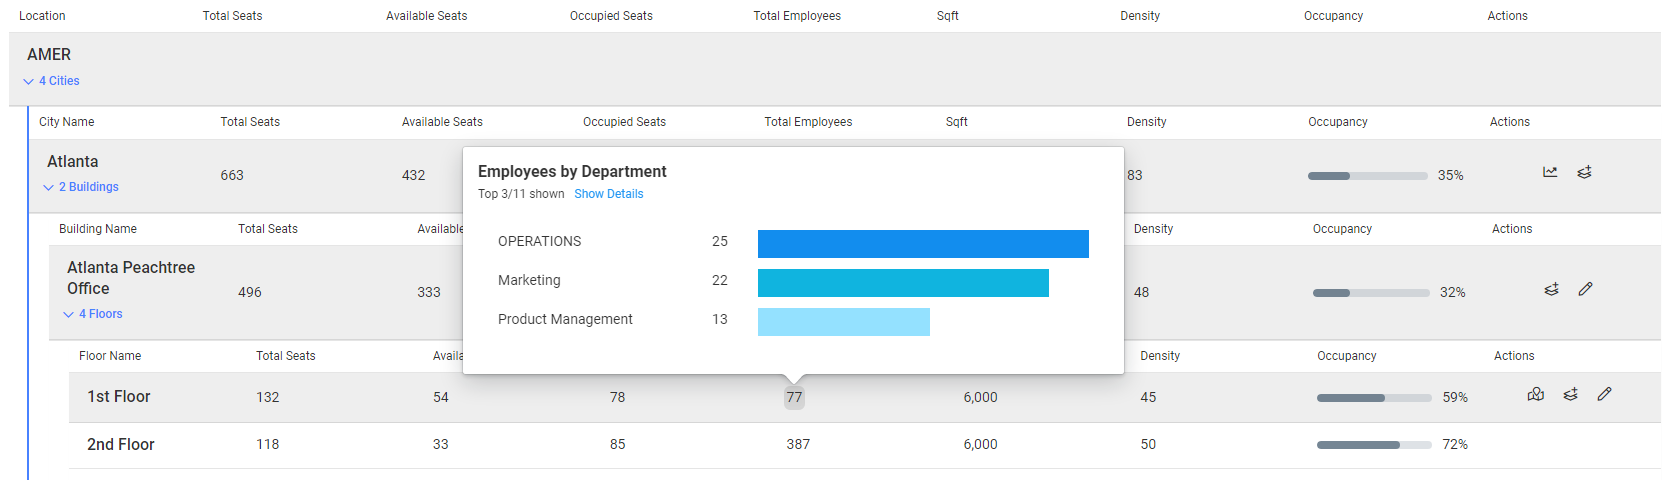
- Total Employees - the total number of employees seated for the building or floor. Hover on the number to display more details and if you click the show details this will take you to the details screen.
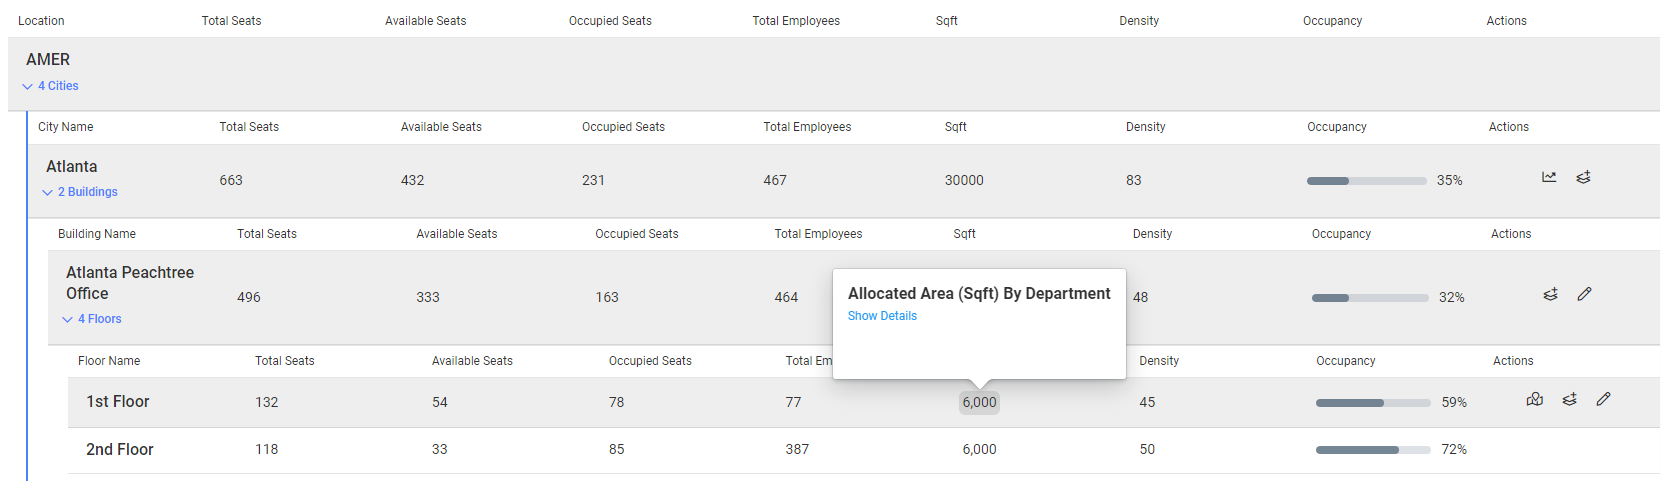
- Sqft - displays the SFTF for the building or floor. Hover on the number to display more details and if you click the show details this will take you to the details screen.
- Density - this is the area per seat in square feet. This is calculated as the Total Square Feet by the Total Number of Seats.
- Occupancy % - this is calculated as Occupied Seats divided by Total Seats and it displays as a percentage.
Remote or No Desk Needed (Hybrid) Employees and Statistics
When you have Remote or No Desk Needed (Hybrid) employees they will not have an assigned seat as when they come into the office they will either book a hoteling desk or a desk associated with their workplace group or neighborhood.
There is an exception here when your employee is marked as a No Desk Needed (Hybrid) employee AND they have an assigned seat then the employee and the seat will be counted in the statistics. For example, your company's CEO or CFO may have a seat in an office space assigned to them.
Learn more about Remote and No Desk Needed (Hybrid) Employees.
More Actions
From the More Actions![]() icon you can either:
icon you can either:
- print the Portfoilo View - this will print the screen and if you want the floor details then make sure the floors are expanded.
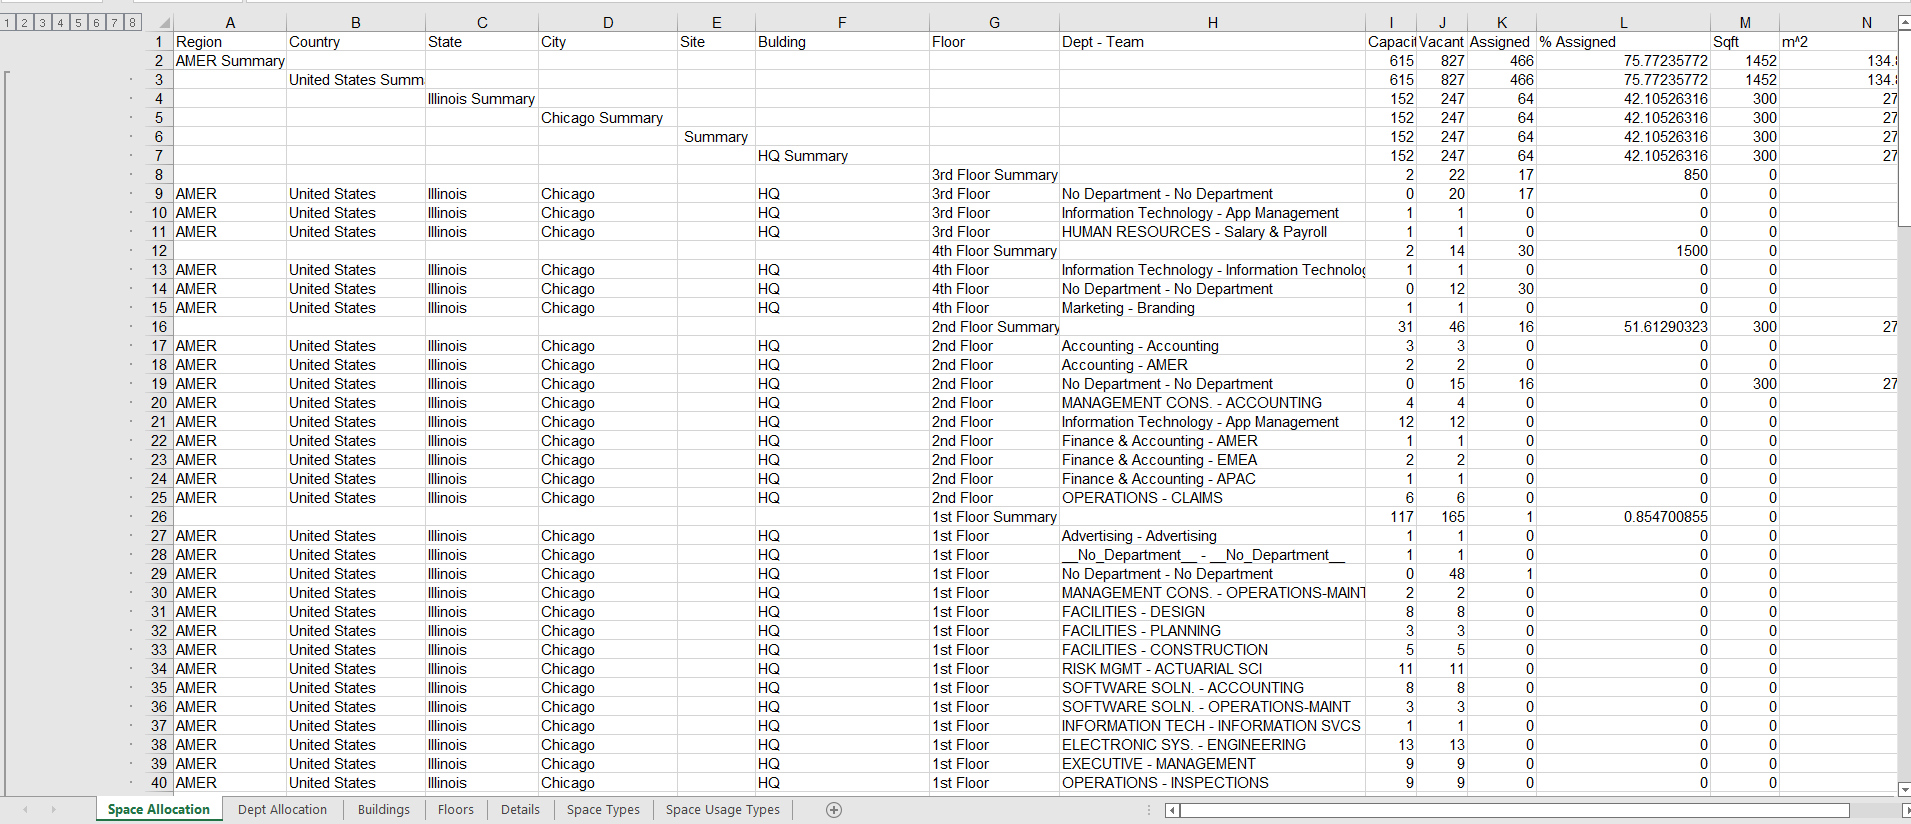
- export to a CSV file - the file contains the buildings and floors details, see the example below.
- navigate to Building Management - this is where you can add or modify buildings and floors' details.