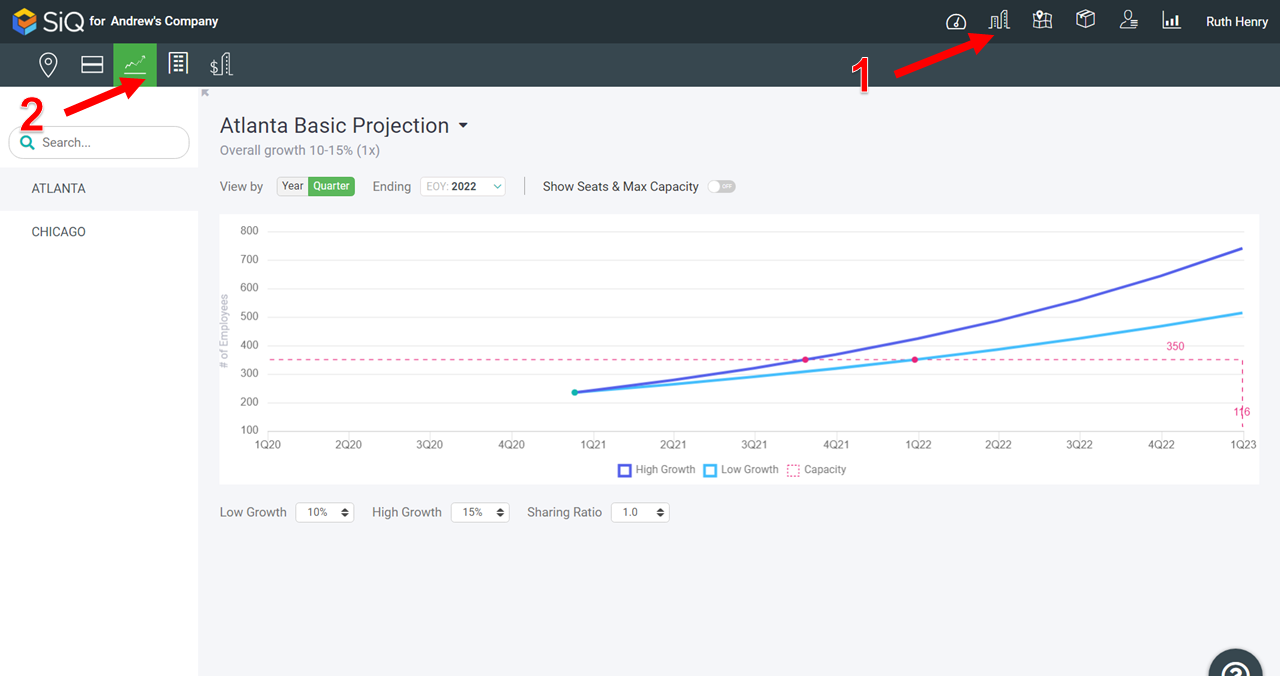
Navigate Projections
Navigate to Projections
To access the stack, click on the Portfolio icon [1] and then the Projections icon [2].
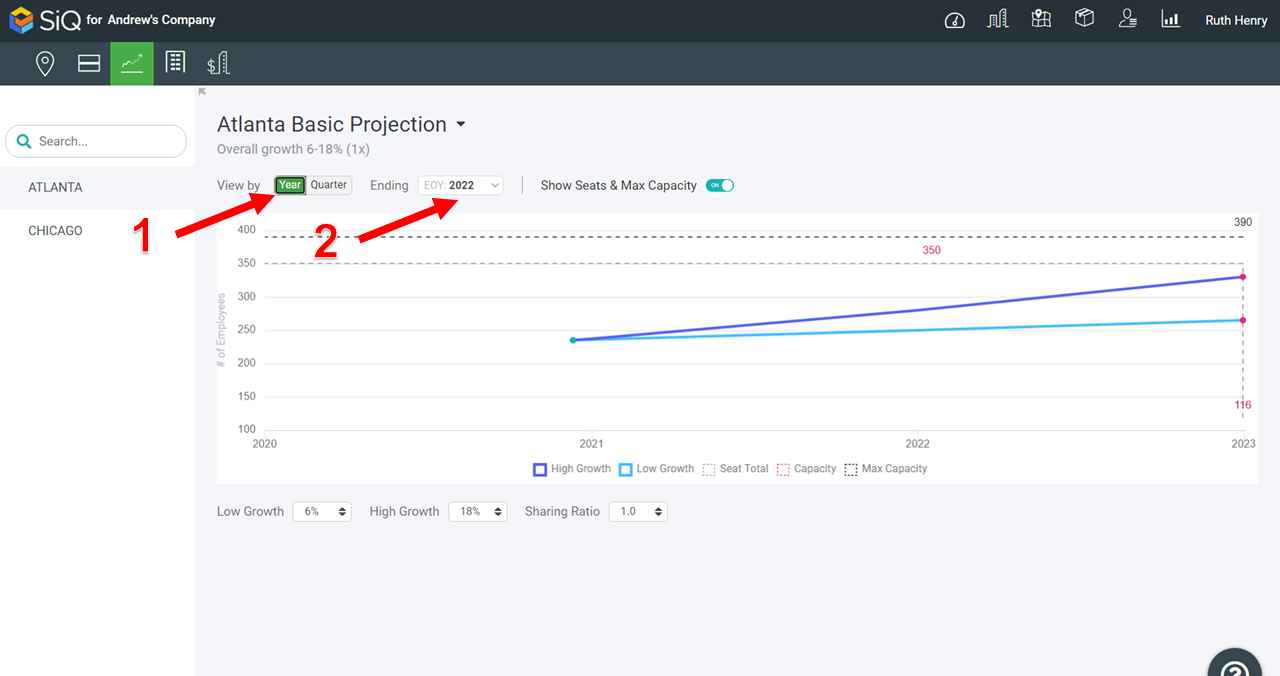
View by Year or Quarter and Year Ending
Each projection lets you view by Year or Quarter [1], and you can change the year ending to a future year; this will let you project up to 5 years.
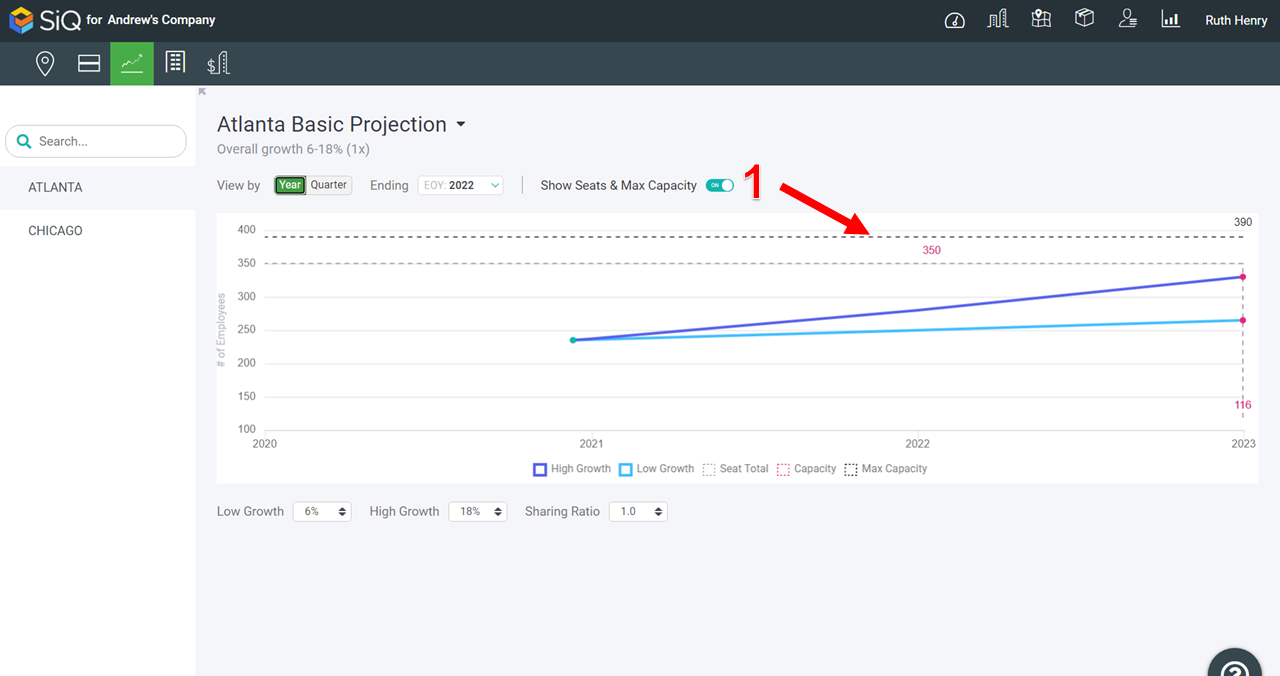
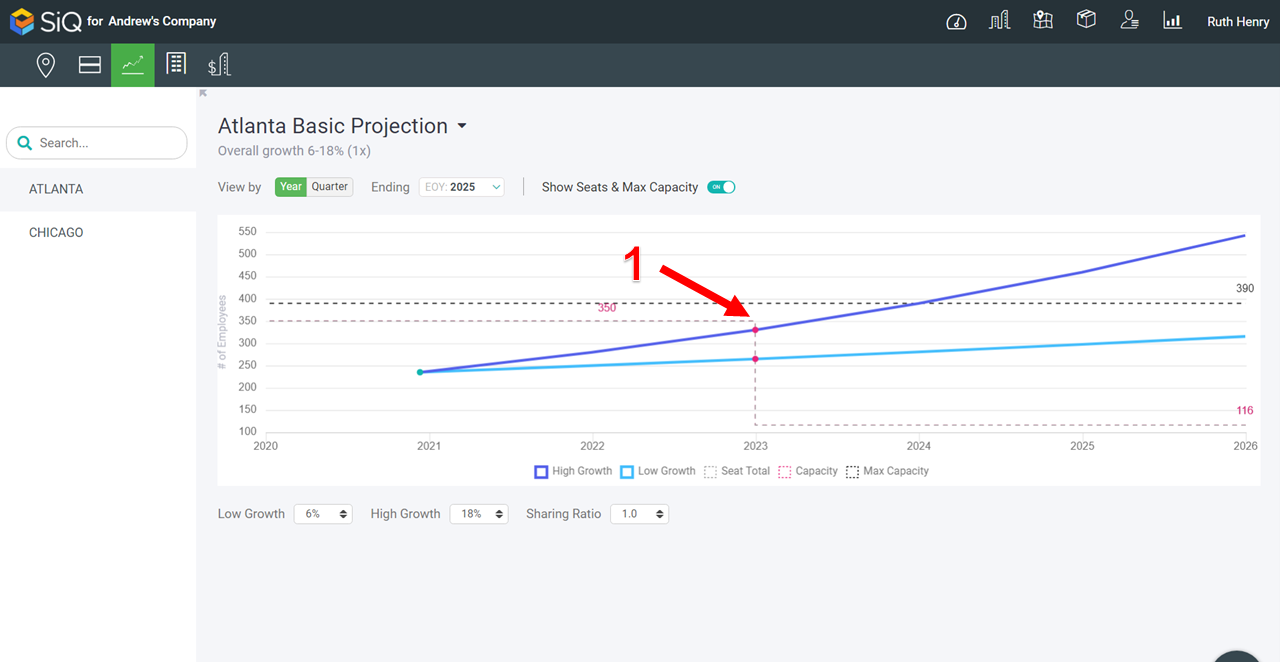
Show Seats & Max Capacity
Each projection also shows you a Seats & Max Capacity line on the graph [1].
The max capacity for the building is set in Manage Buildings and Floors.
Hovering on lines and points on the graph reveals projection details. For example, hover on each graph line to see the occupancy.
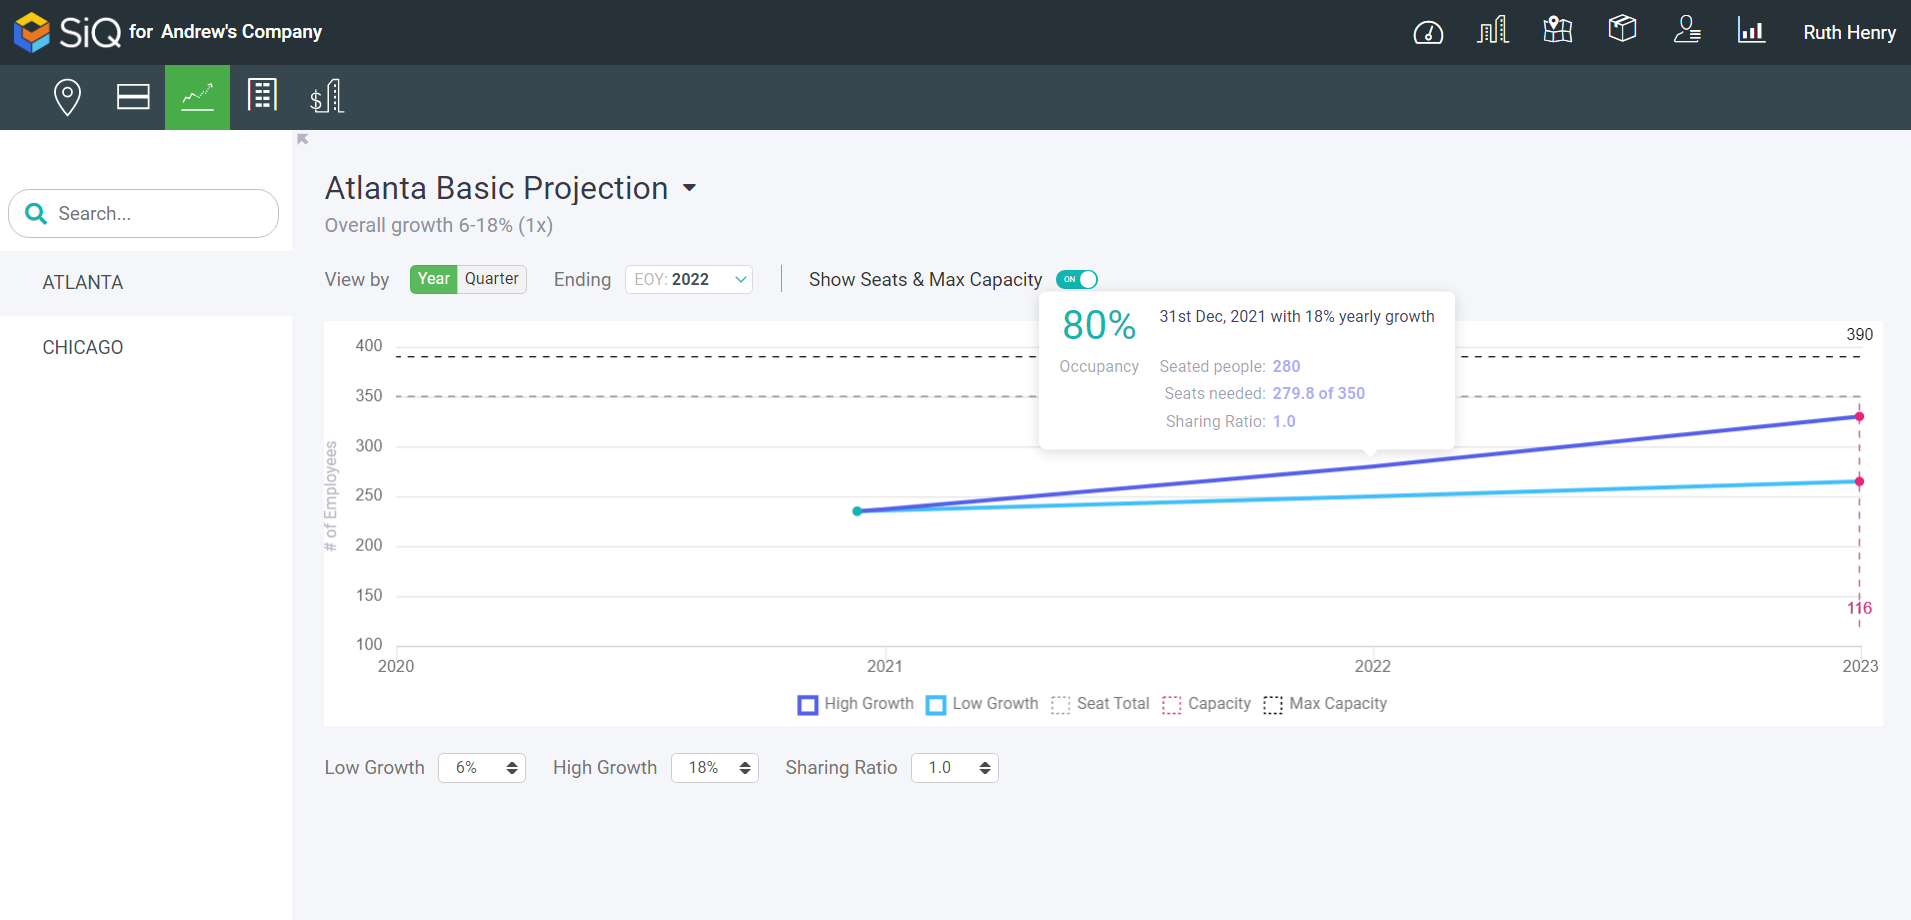
Red dots indicate when you have reached capacity; hover on a red dot to see capacity details.
End of Lease
When you see a capacity line drop in the graph, a building's lease has ended. Remember, the leases are set in Manage Leases.
Projections Options
The following projections can be used, and what you adjust in one projection will not affect the other projections.