Basic Projections
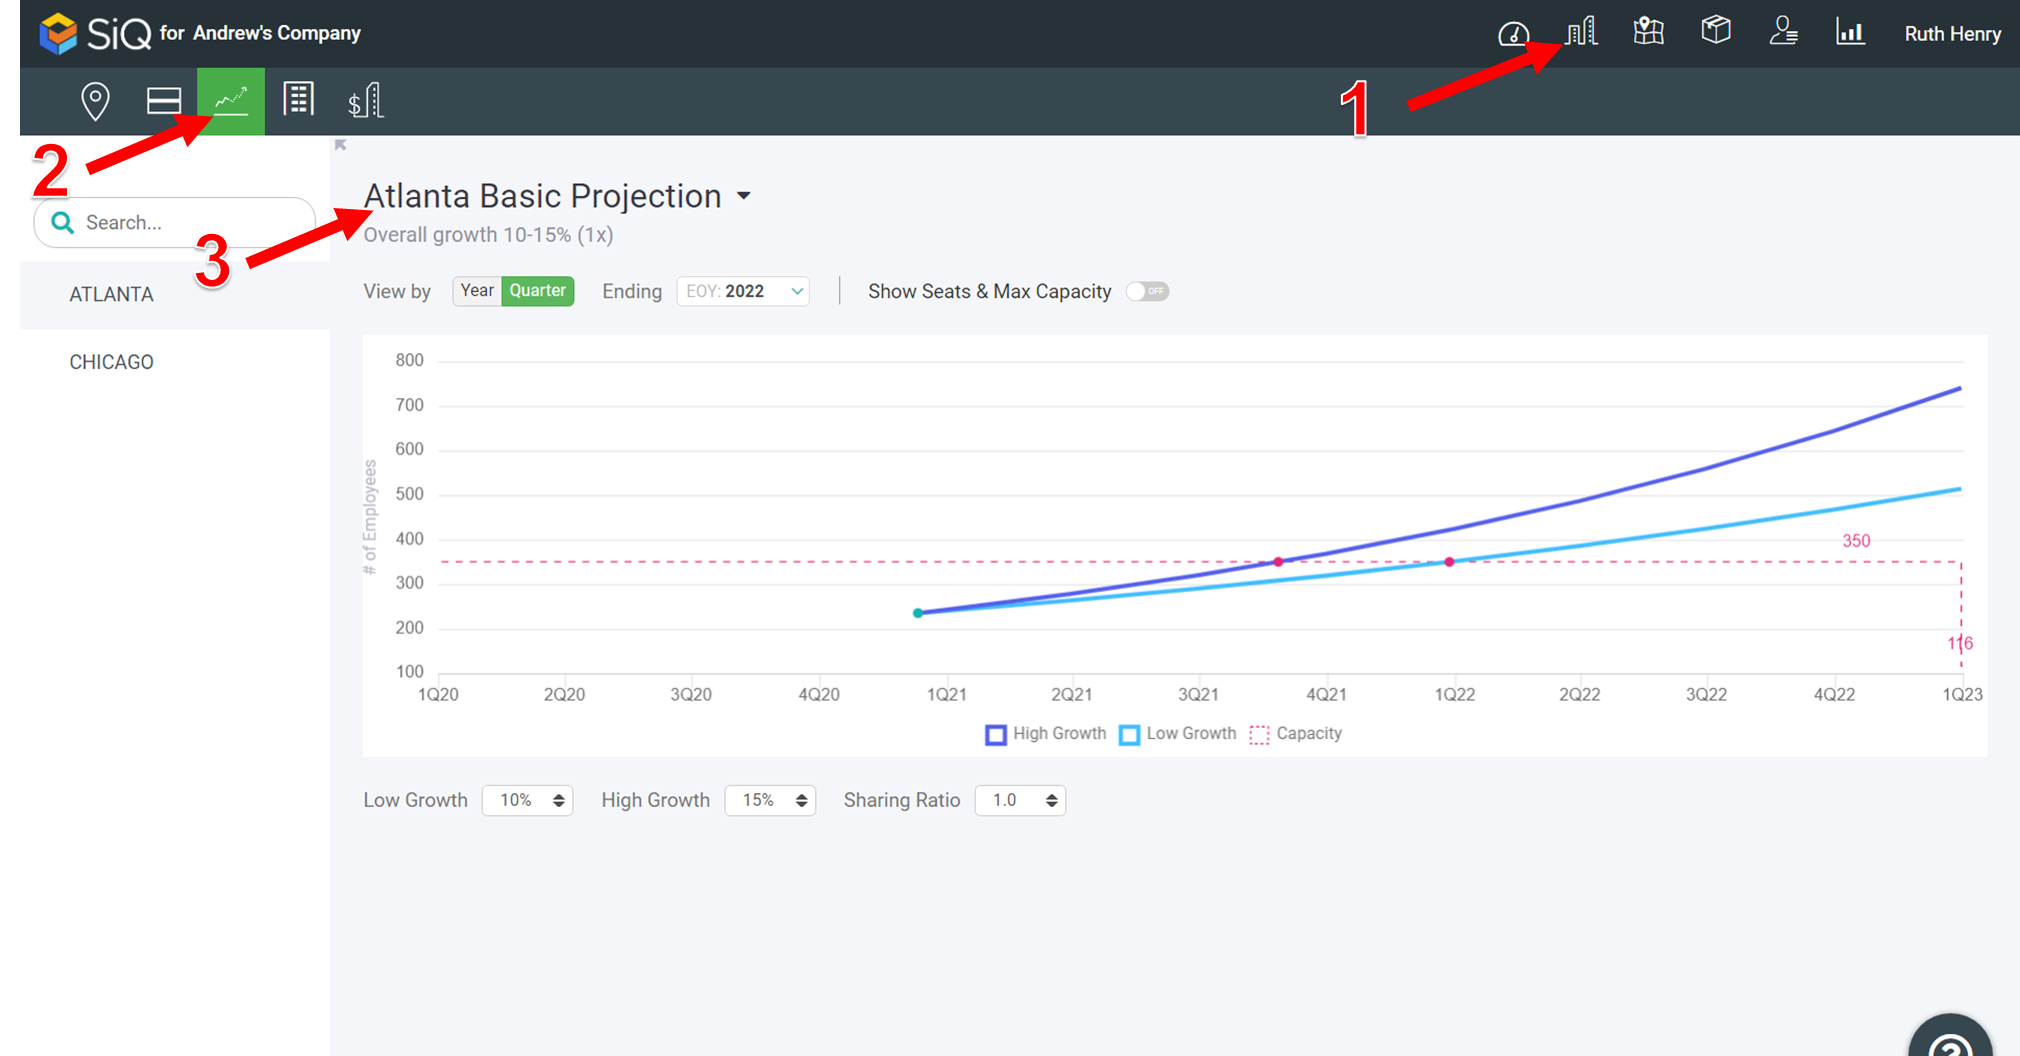
In the Projections Module, the Basic Projections graph displays. This projection can be set to see the impact of Low Growth and High Growth. If you have remote employees, part-time employees, and/or neighborhoods you can see the impact of the sharing ratio.
To access the Projection, click on the Portfolio icon [1] and then the Projections icon [2]. From the Projection drop-down select the city's Basic Projection. [3].
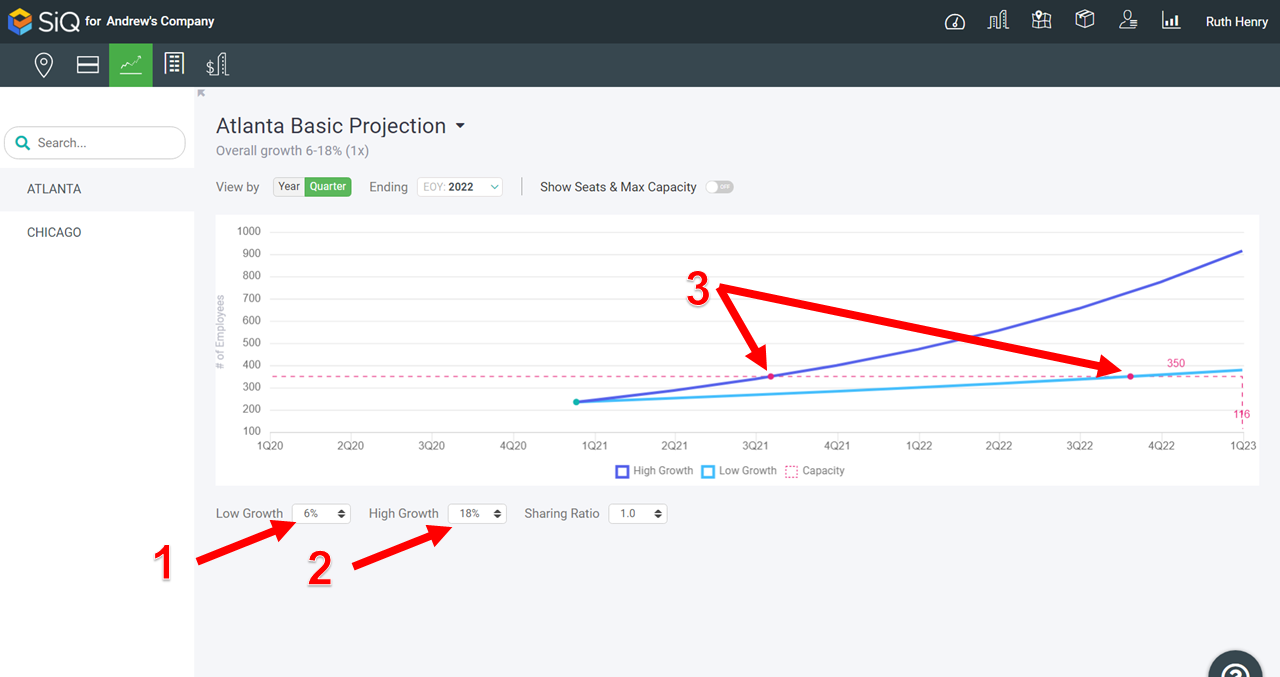
Low Growth and High Growth
Below the graph, set what you expect the Low Growth [1] and High Growth [2] will be. The graph will display when you will reach capacity with a red dot, hover on the red dot to see the details [3].
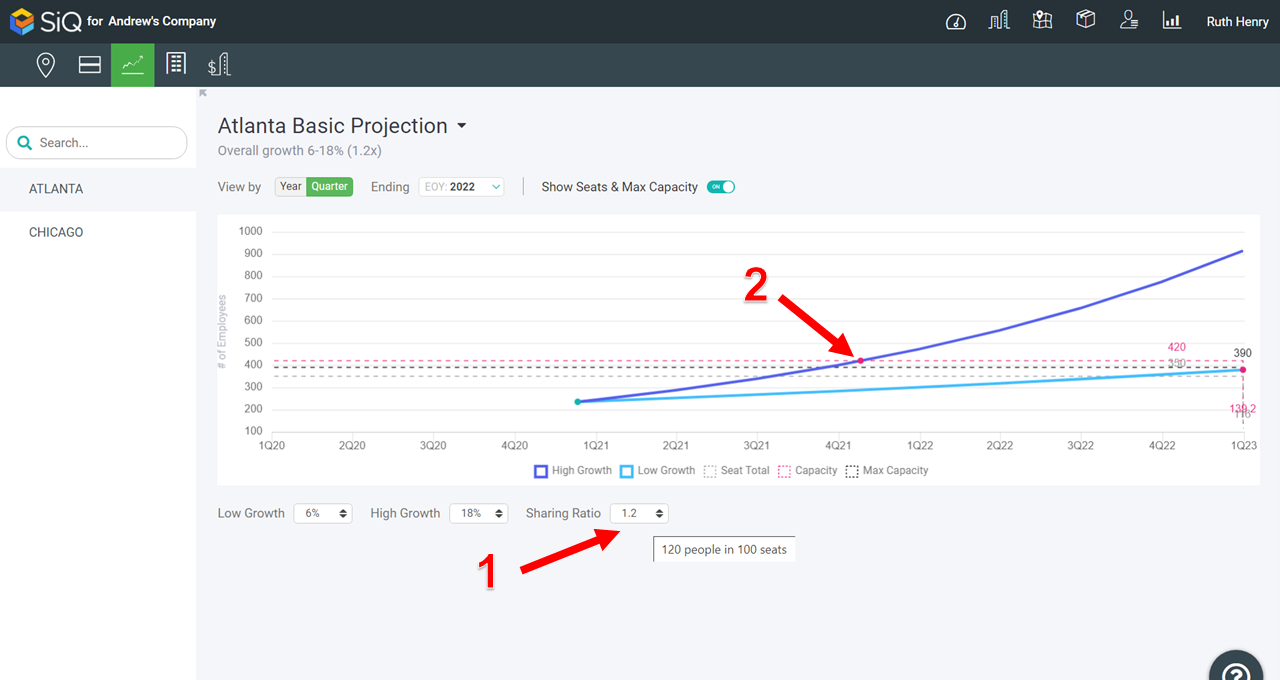
Sharing Ratio
Use the sharing ratio when you have remote employees who occasionally visit the office, part-time employees, or neighborhoods.
- 1.0 Sharing Ratio indicates 100 people to 100 seats. Set the Sharing Ratio to 1.0 when you are not sharing
- 1.2 Sharing Ratio indicates 120 people to 100 seats.
- Hover on the Sharing Ratio to see the number of people to the number of seats.
The graph will display a red dot; Hover on the red dot to see the details [2].