Navigate Reporting
Let's take you through a high-level overview of the various reports available in SpaceIQ and how to access those reports.
To access reports, click on the report icon [1] in the top right corner of the screen. This will take you to the main Reports page, where you'll see a search bar [2], a breakdown of all the report categories [3], and the # of report types in each category.
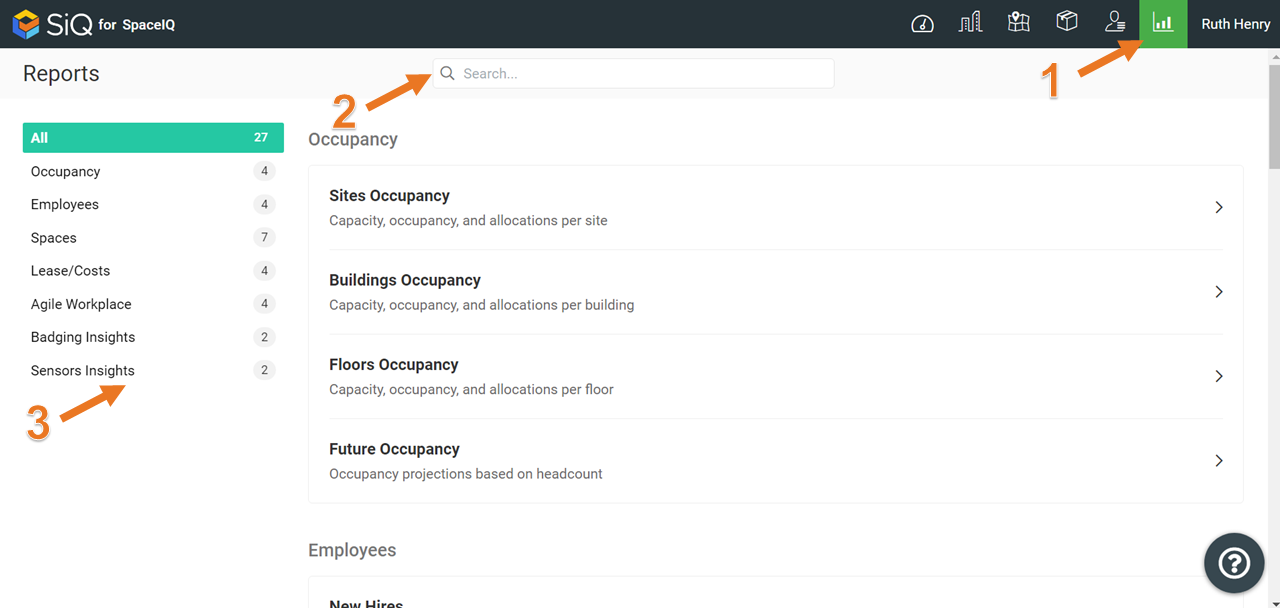
We have separate articles on each of the following report categories:
- Occupancy
- Employees
- Spaces
- Lease/Costs
- Agile Workplace
- Badging Insights
- Sensor Insights
Filters and Export
When you click on a particular report to open it, you'll see filter options [1] at the very top of the report page. The types of filters available will vary based on the report. The entire filter row can be collapsed by clicking on the Filter button. You can also export the current report in CSV format by clicking on the Export button in the top right corner [2].
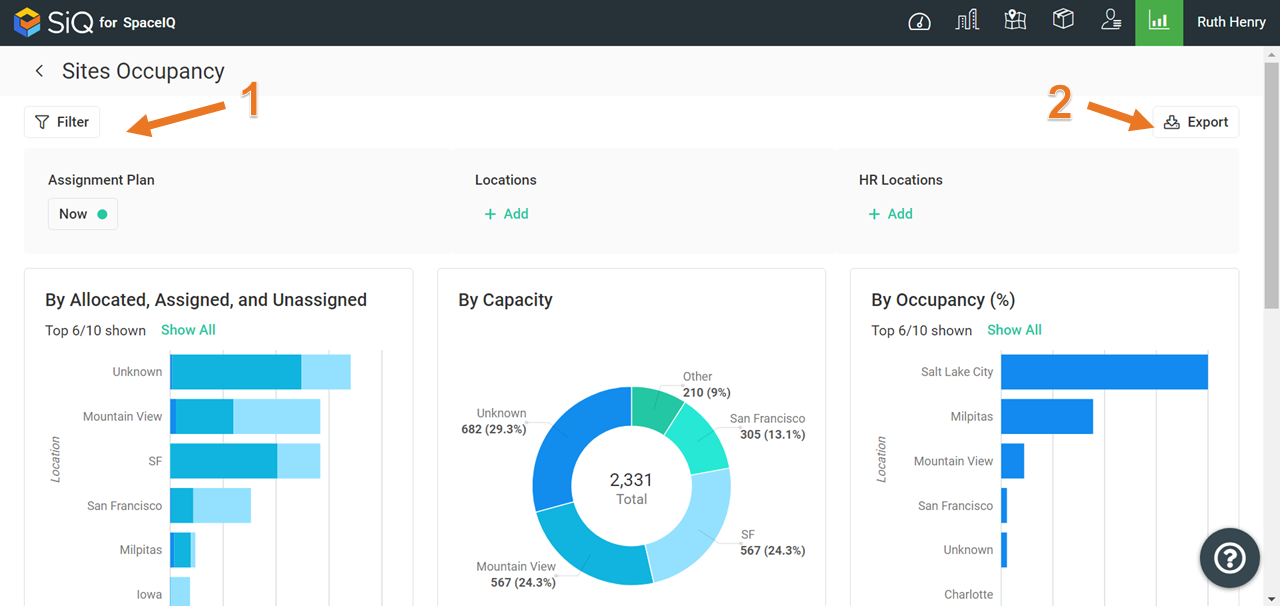
Some filter types include Assignment Plan, Date Range, Locations, HR Locations, Departments, Usage Types, and more.
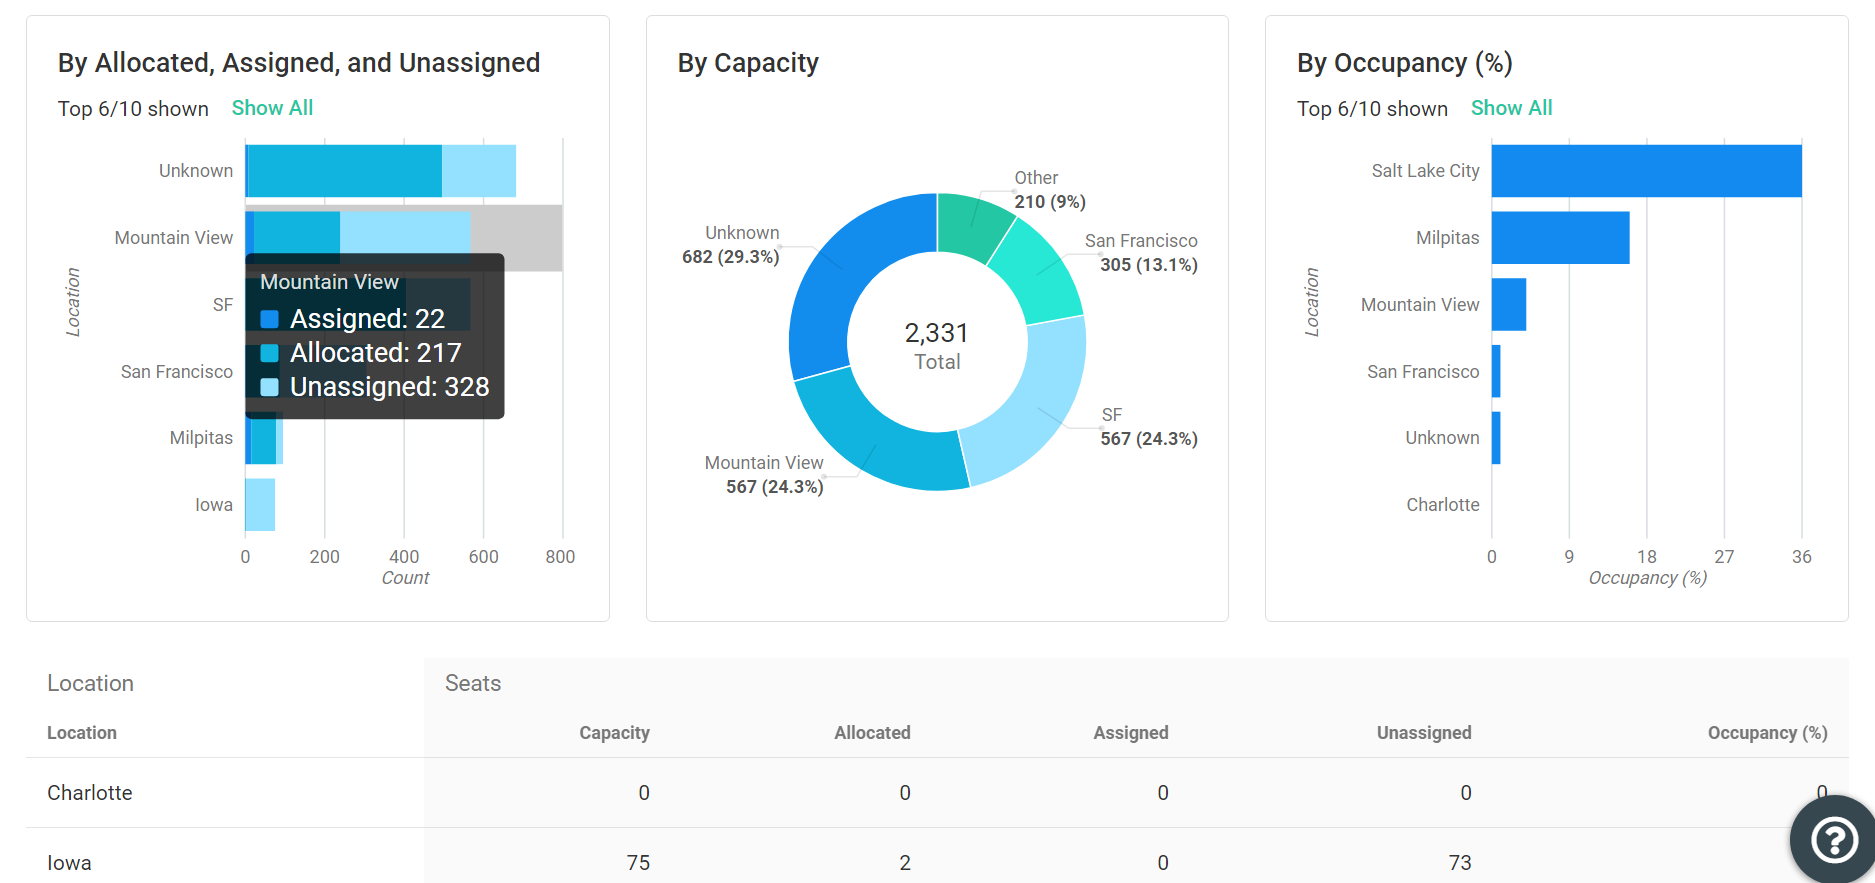
Report Graphs and Summary
At the top of each report, you will usually see applicable charts, graphs, or summaries, with a line-by-line breakout below.
Notice that these graphs are interactive. Hovering over the graph will show additional details, and click on an element within the graph to apply a result filter to all data shown.
When you apply filters, the exported CSV files will also be affected by those filters.