2019 April Product Release
All-In-One Workplace Management Platform
This update includes both Standard and Premium features that will enhance your ability to treat SpaceIQ as an all-in-one workplace management hub.
Ticketing - Standard
SpaceIQ now has a Ticketing feature that allows for easy workplace issue tracking.
- Manage all tickets in a single view, and use filters to refine the list for easier tracking.
- Admins can now create new tickets from within the webapp. Everyone can still submit tickets via the SpaceIQ mobile app.
Ticketing Integrations - Premium
New ticketing integrations with ServiceNow or Samanage allow you to enhance SpaceIQ’s utility as a central workplace management hub.
- The two-way integration style means you can complete tickets in SpaceIQ, and they’ll reflect in your third-party ticketing program, and vice-versa.
- Integrating your existing ticketing program into SpaceIQ allows you to smoothly fold issue tracking into your broader workplace management approach.
Executive Dashboard - Beta
Our new Dashboard feature provides a quick, high-level digest of key stats and other important information from across SpaceIQ.
- See easy-to-read visualizations of aggregated data for things like lease expiration dates, costs, and employee types in the form of charts and calendars.
- The Dashboard provides a shortcut for KPI reference or for executive-level users who don’t deal with things like seat assignments but still want access to the important information in SpaceIQ.
Projections - Premium
The Projections tool now offers more granular options for looking at future headcount projections by building and department.
- Use the Projections by Department option to see specific growth predictions for one or more specific departments as part of a location’s general growth trend.
- Use the Projections by Building option to see which of your buildings are heading toward capacity
- A new data import option allows you to add historical headcount data for each building to improve forecasting accuracy based on past growth. New and current users can add their past data to kickstart their Projections.
Financial Forecast by Building Report - Premium
The new Financial Forecast by Building report provides high-level and granular cost data for specific buildings in your Portfolio.
- See current and projected future information tied to spending for each building.
- Import historical cost data through the Cost Module to improve financial forecasting accuracy for this report. For new and current users, data imports allows for the immediate use of Reports, even if the system hasn’t gathered much current data yet.
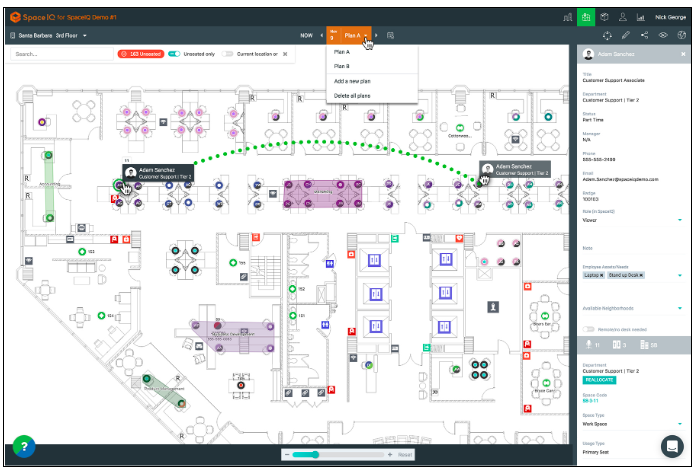
Performance Improvements for All
See Floor Maps more quickly. Maps now load in phases, starting with a floor plan image, then filling in more detailed information such as seats and assignments. This allows you to get a clearer look at each floor as it loads, even if it’s a crowded layout with a lot of information on display.