New Stacking Diagram Features
Additional features have been added to the Stacking Diagram in the Space module to provide you with more robust functionality. The drag-and-drop functionality has been improved to allow for dragging to multiple buildings using a new Shelf section. You can also view new capacity details on the Stacking Diagram, which can help you visualize potential moves and reorganization efforts more efficiently.
Refer to the following list for information on the new features available for the Stacking Diagram.
- Multi-building drag-and-drop options. To help you plan for potential moves across your entire portfolio, a new Shelf section has been added to the Sidebar on the Stacking Diagram. This new section builds on the existing drag-and-drop functionality, providing you with a location to temporarily drop groups of users without adding them to any floor or building. You can then switch to a different building in your portfolio and move the users to the new location.
To access the Shelf section, simply click the Actions button and then select the Show Sidebar option. When the legend displays, click the (Rotate) button to display the new Shelf section. Alternatively, you can attempt to drag-and-drop an item on the Stacking Diagram to display the Shelf section automatically.
This new feature can help you visualize potential moves between buildings, saving time when reviewing options for consolidation moves. Suppose you are over capacity in one building and are considering moving a couple fast-growing departments to a new location. Using the Shelf section, you can drag the departments from their existing location directly to the new building, allowing you to immediately visualize the impact the move would have on capacity in both locations.
This new section can help you plan for department consolidation and similar structural moves before they happen, providing you with the vital impact analysis you need prior to implementing large moves between locations.
As with the previous iteration of the drag-and-drop feature, none of the changes you make currently will be saved, so feel free to play around with this feature worry-free. You can reset the Stacking Diagram by clicking the new Undo All changes option in the Actions submenu.
- New floor capacity statistics. Additional capacity indicators now display for each floor on the Stacking Diagram. When a floor is over capacity, an indicator line now displays to illustrate the current capacity status. Additionally, indicator lights display at the end of each floor, allowing you to quickly determine the available capacity on the floor. You can also hover the mouse cursor over either the over-capacity indicator or an indicator light to display additional capacity statistics for the corresponding floor.
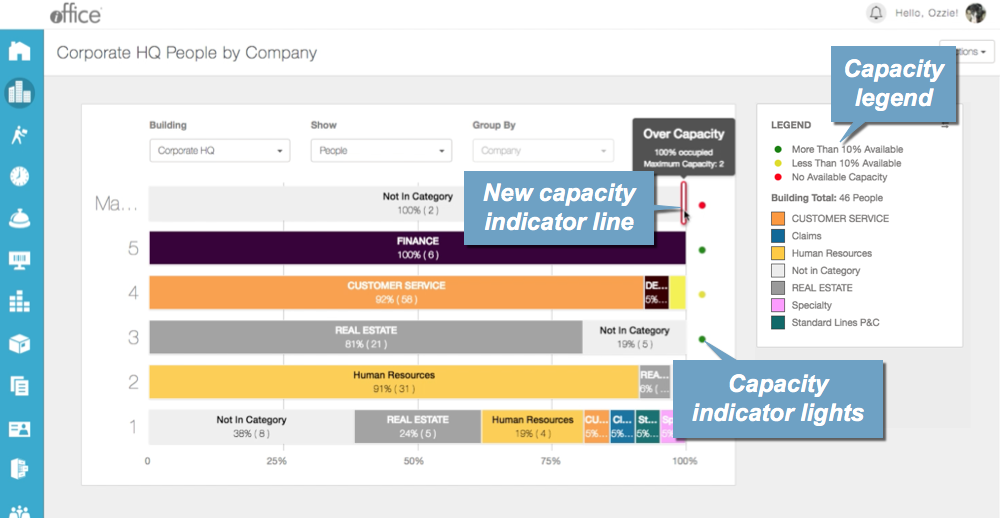
The new capacity indicators work in conjunction with the Shelf section and are automatically updated as you move people on the Stacking Diagram. These new features provide you with a real-time reflection of your floor-by-floor utilization, allowing you to come up with creative solutions to effectively organize people and get the most out of your existing space.
The new Shelf section and available capacity information can help you fully understand the impact of a potential move on your entire portfolio, allowing you to plan for future capacity requirements. These interactive new features will be available to all customers with the Space module in the coming weeks. If you have any questions, please call 713-526-1029 or send an email to support@iofficecorp.com.