Fresh Look for Space Desktop
The Space Desktop is getting a fresh look to end the year, with a new color scheme to align more closely with iOFFICE branding as well as a few changes to button locations and sensor graphs. These enhancements build upon the recent updates we have made to this feature (such as the ability to toggle between modes) and increase overall consistency in the iOFFICE application. Refer to the following list for more information on these changes.
- Sharpened text and intuitive button location. With this redesign, we are sharpening the text displayed on the Space Desktop to improve legibility. In addition, the buttons available on this screen are being relocated to the bottom of each view in a new "action bar." These minor adjustments not only make the screen easier on the eyes, but they also increase efficiency by moving less frequently used options out of your main line-of-sight. For example, if you notice an error while viewing a user record in the User View, you now click the More button at the bottom of the view to access the Edit option.
Similarly, if you want to view the Stacking Diagram for a building, this option is now available at the bottom of the Building View since this is not the primary purpose of the view. These changes allow you to focus clearly on the most important information while retaining the ability to switch tasks when needed.
With the sharpened display, we are also improving the way names display on the floor plan when space is limited. For example, when viewing the floor plan from a higher level, names can now display as the first initial and last name of employees to allow additional information to display.
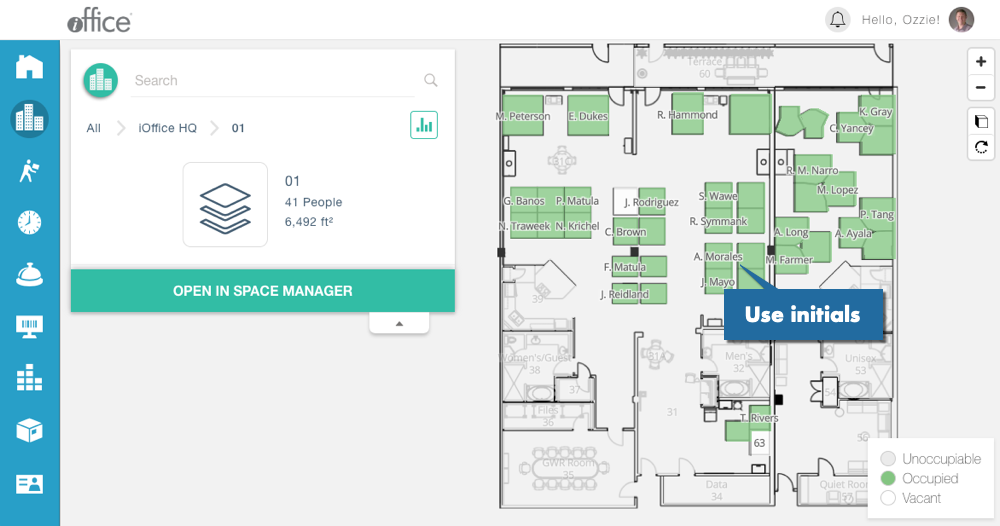
These updates allow for improved interactions with floor plan data by increasing the availability of data at all views and levels.
- Improved sensor graphs. For customers who are utilizing workplace sensors, we are combining the graphs available for headcount and utilization sensors into a single view, allowing you to view data from multiple sensor types without needing to toggle between graphs.
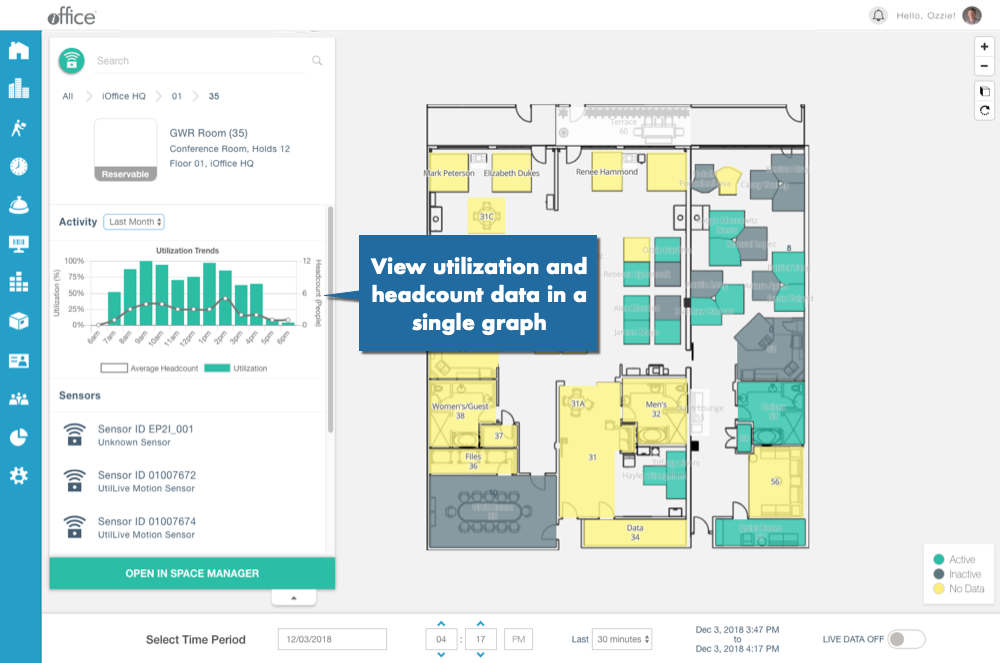
This updated view allows administrators to get a snapshot of their sensor data in a glance, eliminating the need to toggle between views.
- Removed the Fullscreen button. On a minor note, we are removing the Fullscreen button from the floorplan map on the Space Desktop. This removal frees up space for more useful features, including the recently added 3D floorplan button.