
Filters

Eptura Knowledge Center

Filters

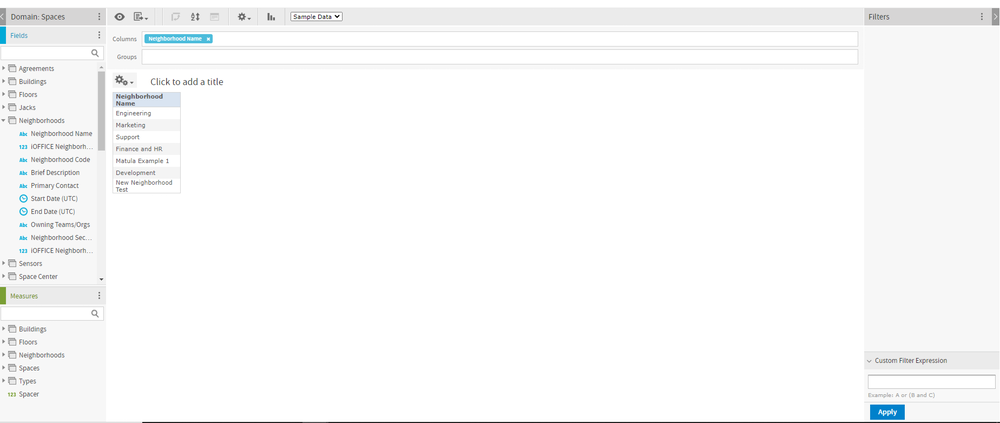
The filters panel allows you to display any filters defined for the view. You can set the filter values and see the resulting change in the Reports View panel. 


  1. To hide the Filters panel, click the Reports Filters_Icon_Mini.png icon in the top left corner of the panel. 

Reports Filters_Icon.png

Figure: Filters Panel - Minimized

  1. Click the same Reports Filters_Icon_Mini.png icon on the minimized panel to expand it again. 


Reports Filters Panel_Maximized.png

Filters Panel - Maximized


There is also a drop-down menu on the right side of the maximized Filters Panel that allows you to perform three options:

  • Minimize All Filters: minimizes all filters selected for your report

  • Maximize All Filters: maximizes all filters selected for your report

  • Remove All Filters: removes all filters currently selected for your report


In the Filters Panel, you are also able to enter a Custom Filter Expression.


If your report contains more information than you want, you can filter it to display what you need. Conditionally filter report output by first selecting the column to use as a basis for filtering. Next, enter a filter condition, then a value for comparison. The server compares each field of the column to the value that meets the condition.


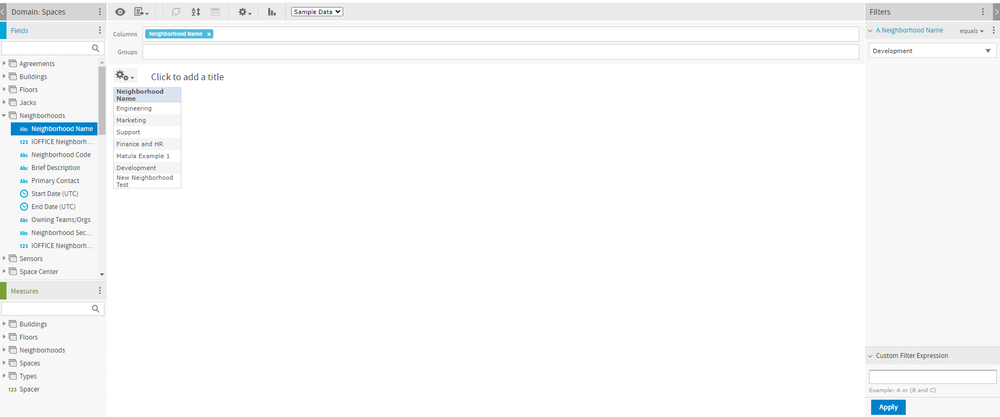
A list of conditions available for each type of column (numeric, date, and text) is listed below.

Numeric

Date

Text

Equals

Equals

Equals

Does not equal

Is not equal to

Is not equal to

Greater than

Is between

Contains

Greater than or equal to

Is not between

Does not contain

Less than

Is on or before

Starts with

Less than or equal to

Is before

Does not start with

Is between

Is on or after

Ends with

Is not between

Is after

Does not end with


Please Note: Date filter values will be applied as UTC timezone values, but the report fields will still render with UTC or center timezones depending on which was selected by the user when creating the report.


Filtering Report Data

  1. As you run your report, click the column you want to use for filtering the report. 


reports_filter_report_1c.png

Figure: Filter Report


  1. Click the reports_filter_icon_1a.png. The Filter column appears. By default, Show all rows is selected. 


reports_filter_column_1e1.png

Figure: Filter Column


  1. To build your filter, click the radio button to select Show only rows where

  2. Select a comparison operator from the drop-down. 


reports_comparison_operator_1a.png

Figure: Comparison Operator


  1. Enter a value for comparison with the data in the column and click the OK button.  The view of report changes to show your filtered output.  

  2. A small star icon appears in the heading of the filtered column, to the right of the heading text. To clear the filter indicator and once again display all the accounts, reopen the Filter column dialog and select Show all rows, then click OK


Sorting a Report

You may also sort your report information alphabetically in ascending or descending order.

  1. Click the column you want to use for sorting the report. 

  2. Click the reports_ascending_1.png (sort ascending) or reports_descending_1.png (sort descending). The report refreshes and the data appears sorted by the selected column.  


Moving, Resizing, and Hiding Columns

Columns are easily moved, resized, and hidden in your report.

  • To move a column, click the column you want to move, then drag the column left or right into the new position. The reports_drag_column_1.png indicates where the column is placed.


reports_moving_columns_1a.png

Figure: Column Movement


  • In order to resize a column, click the column you want to resize, then drag the reports_drag_column_1.png until the column is the size you want. 


  • To hide a column, click the column you want to hide, then move your mouse over the reports_formatting_icon_1.png and select  Hide Column.    


reports_hide_column_1a.png

Figure: Hide Column


Setting Output Scale

You can determine the display size for any report by using the report scaling options, located in the Report Viewer toolbar. 

  • Click reports_increase_size_icon_1.png to zoom in on the report.

  • Click reports_decrease_size_icon_1.png to zoom out on the report.

  • Click reports_increase_size_report_icon_1.png to open the Zoom Options drop-down menu, and select the percentage by which you want to increase or decrease the size of the displayed report. 


Navigating the Report

If your report has multiple pages, you can use the pagination controls to move through the report quickly.

To navigate the published report:

  • Use reports_previouspage_icon.png to navigate to the previous page.

  • Use reports_nextpage_icon.png to navigate to the next page.

  • Use report_movetoend_icon.png to go to the end of the report.

  • Use report_movetobeginning_icon.png to go to the beginning of the report. 

  • If you know the number of the page you want to view, enter the page number in the Current Page indicator box. 


Related Topics

Creating Reports