View Neighborhood details in Space Desktop
Neighborhood information gives Space Planners a summary of the neighborhood's area and space types.
Navigate to the Neighborhood
- Navigate to Space > Space Desktop.
- The Mode icon at the upper right-hand corner will display in the Information Mode
 .
. - Navigate the floor.
- From the panel click the Neighborhood you want to view.
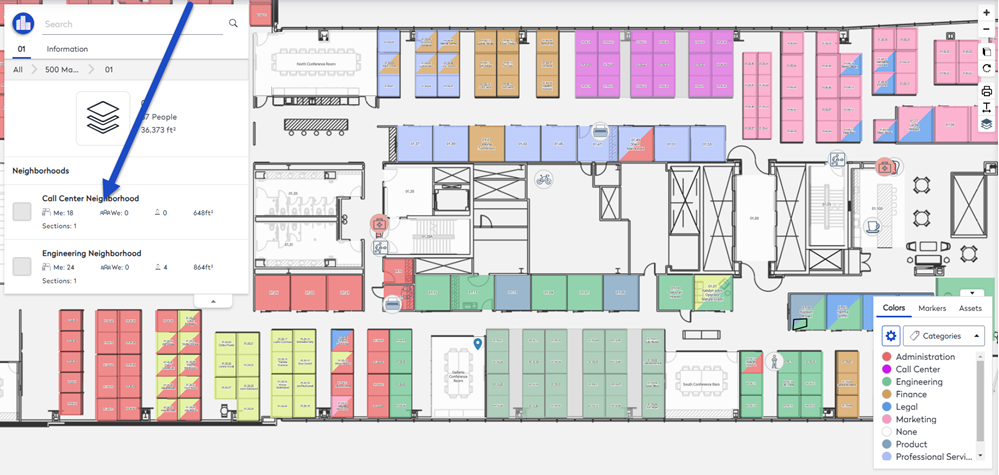
The panel displays the tabs Sections, Spaces, and Members.
View the Neighborhood Section on the Floor
If you want to know where the neighborhood section is on the floor, then in the panel, hover over the neighborhood section and it will highlight on the floor.
Additionally, you can hide or show the neighborhood.
- Click the Show
 icon to hide the neighborhood section on the floor.
 - Click the Hide
 icon to show the neighborhood section on the floor.
View the Spaces
If you want to see the space names in a list, then click the Spaces tab.
View the Members
If you want to see the people who are associated with the neighborhood, click the Members tab.
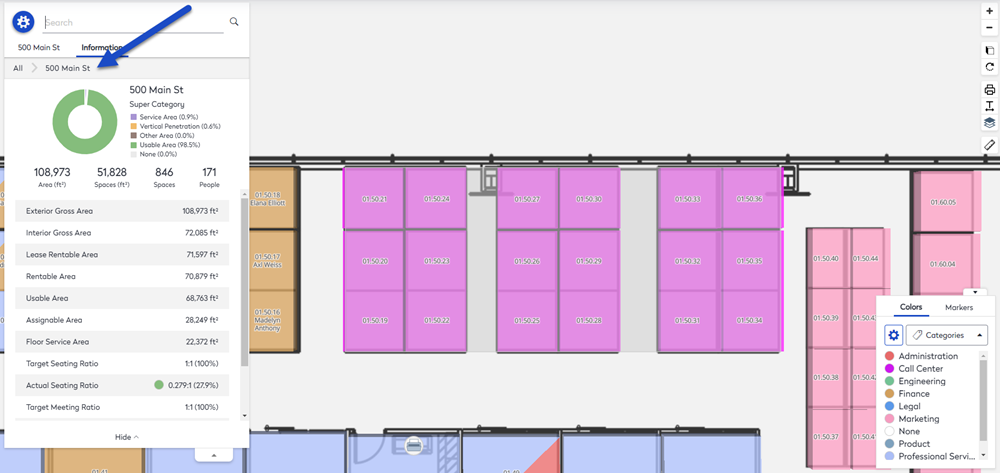
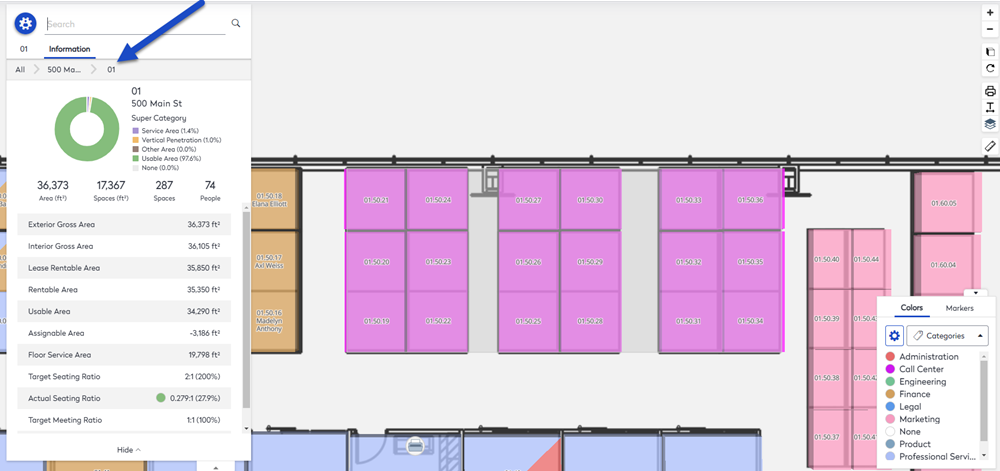
View the Neighborhood's Statistics
The statistics can be displays, click the Information tab.
The target ratios can be updated, learn more in Update the Target Ratio.
Statistical Definitions
- Spaces (Square Footage or Meters) - The total area of all p-lined spaces within the neighborhood or neighborhood section boundary.
- Spaces - The total number of p-lined spaces (occupiable and non-occupiable) within the neighborhood or neighborhood section boundary.
- Capacity - The total capacity of all p-lined occupiable spaces within the neighborhood or neighborhood section boundary.
- Members - The total number of users, both assigned and hybrid, that is assigned to the neighborhood or neighborhood section
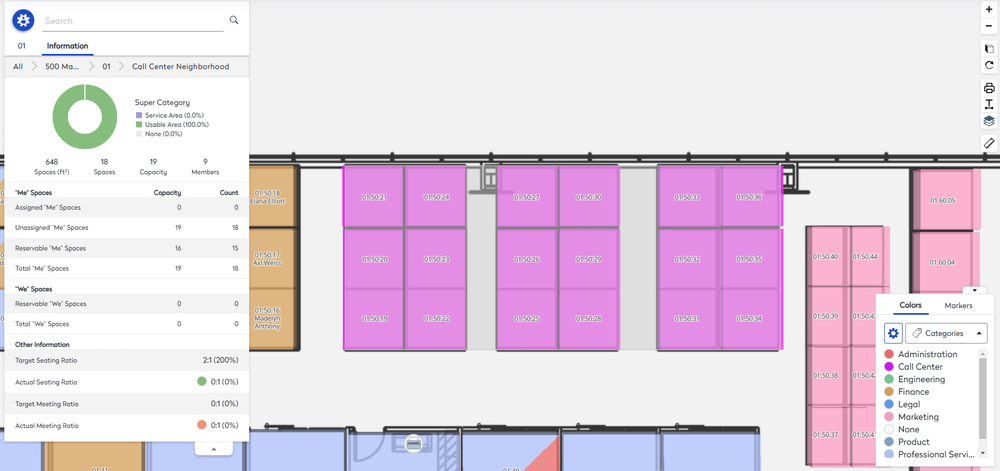
- Me Spaces and We Spaces - The number of reservable spaces is not counted twice – these counts are found in the ‘unassigned’ totals.
Other Information
This section displays statistics for the ratios.
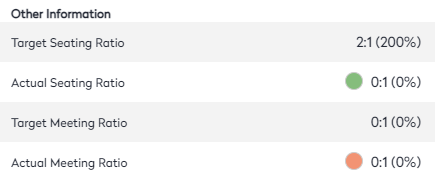
The Target Seating and Target Meeting ratios are based on occupancy and capacity. These statistics are calculated:
| Target Seating | planned occupancy / capacity |
| Actual Seating | actual occupancy / capacity |
| Target Meeting | # conference seats / capacity |
| Actual Meeting | # conference seats / occupancy |
The Actual Seating Ratio and Actual Meeting Ratio will reflect based on the target seating and meeting ratio. The ratio is visually represented by the dots next to the seating and meeting ratio.
| Green | 0 to 90% of target ratio |
| Yellow | 90 to 99% of target ratio |
| Red | 100% or above target ratio |
These statistics can be viewed from the Floor level or the Building level.
View the Target Ratio Statistics for the Floor
- Click the floor number. The statistics display for the floor.
View the Target Ratio Statistics for the Building
- Click the building. The statistics display for the building.