2023 February Insights Product Release
Baseline Metrics
Baseline Metrics has been moved from Beta Release to General Availability Release
Baseline Metrics is a new set of metrics we have worked hard to develop that provide better usability and flexibility when compared to all other metrics. The meaning of the metrics is effectively identical, but the calculations are done at the lowest possible level. These metrics can be used in place of the previously distinct Space, Team, Neighborhood, Floor or Building metrics.
Learn more in Baseline Metrics and watch the metrics in action in the Space Type Summary Dashboard.
Insights Editor
Released February 2nd
Insights Editor updates include:
- UPDATE - We have made updated the Person - Location Updates Explore to include more Views for Person’s self-joined location data, as well as cleaning up redundant History Date fields.
Dashboards
Released February 15th
Dashboard Moved
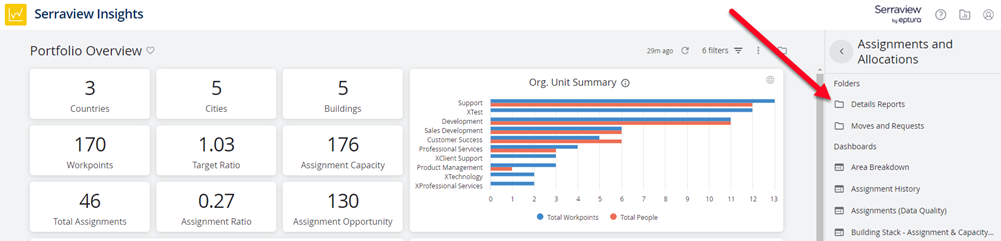
The Details Reports folder's dashboards have been moved to their respected folders.
Assignments and Allocations > Details Reports folder now contains:
- Asset Details
- Assignment Details
- Building Details
- Floor Details
- Neighborhood Details
- Service Request Details
- Space Details
- Team Details
- Village Details
Assignments and Allocations > Details Reports folder now contains:
- Badge Utilization Details
Utility Dashboards > Details Reports folder now contains:
- Org Unit Details
- People Details
Dashboard updates include:
- NEW - Utilization Visualization Per Floor Dashboard - This dashboard provides a visual floorplan representations of what data is coming from what source. This is useful for both issue diagnosis and understanding what sources are providing the most information.
- UPDATE - SVLive Building and Floor Utilization Dashboard
Now includes the following special data elements:
-
Attendee Days/Week - The number of days attendees are detected in a given week. Attendees are categorized by the number of days they appeared that week and that % is the % of attendees for that week that appeared for that many days. If the filter contains a partial week, it will skew that weeks data.
Attendee Days/Month - The number of days attendees are detected in a given month. Attendees are categorized by the number of days they appeared that week and that % is the % of attendees for that week that appeared for that many days. If the filter contains a partial month, it will skew that months data.
Now includes the following filter:
- Provider Name (requires OR is null) - This filter affects how minutes are calculated (for the Daily Minutes filter), and what sources are included. The ‘Combined’ providers includes both SVLive Wi-Fi and Wired, and aggregate the minutes to the bracketed level (for example, ‘Combined(Building)’ removes all overlap of minutes at the building level. Regardless of selection, you must include ‘OR is null’ to have correct occupancy metrics (Total Workpoints, Total People).
Released February 2nd
Dashboard updates include:
- NEW - SVLive Essentials Dashboard - This dashboard provides the most essential information regarding SVLive. How SVLive data has been trending, how many attendees each day where detected and what each locations utilization % is included. To provides the core utilization information for making strategic decisions and creating informed occupancy plans.
- NEW - Combined Utilization Essentials Dashboard - This dashboard provides the most essential information regarding utilization. How utilization data has been trending, what data sources are contributing, and how many attendees each day where detected. This provides the core utilization information for making strategic decisions and creating informed occupancy plans.
- UPDATE - Updated the color scheme in the Utilization Visualization Per Floor Dashboard to match the scheme in other mixed utilization dashboards
- UPDATE - A wide set of dashboards that have a daily visualization of some kind. Now occupancy metrics (such as total workpoints) will be based off history data rather then just using the latest date.